Myanmar’s trade and its potential
A recent paper (Ferrarini, B. 2012, Myanmar’s Trade and its Potential, to be published soon) assesses Myanmar’s merchandise trade against potential by fitting an augmented gravity model to a panel data set of 2000-2010 yearly exports by six member countries (Cambodia, Indonesia, Malaysia, Philippines, Thailand, Viet Nam) of the Association of Southeast Asian Nations (ASEAN) to key destinations in Asia and the rest of the world. The estimates are used to predict, out of sample, Myanmar’s exports to these destinations in a scenario that assumes the country having the same market access as do other member countries of ASEAN, absent any special sanctions or restrictions to trade with Myanmar.
Myanmar’s actual exports are found exceeding gravity exports between 2000 and 2007 (Fig. 1). This is because gravity predicts an extremely low potential at Myanmar’s level of income compared to that of the six reference countries. Moreover, actual exports by Myanmar during that period were boosted by exceptionally high trade with a few specific countries, pushing actual exports to these destinations far beyond the levels predicted by gravity. For example, natural gas exports to Thailand alone constitute nearly half the value of Myanmar’s total exports value.
Figure 1: Myanmar’s Total Exports (USD millions deflated to 2000)
.png)
Source: author’s calculations.
Myanmar’s GDP growth (in constant US dollar terms) accelerated during the second half of the 2000s, exacerbated by a strong appreciation of the Kyat against the US dollar. Consequently, Myanmar’s gravity export potential grew almost exponentially, from 2007 onward and particularly from 2009 to 2010, reflecting also the boost to trade from a rebounding global economy. Meanwhile, Myanmar’s actual exports were largely unresponsive to rising output and increasingly were falling short of potential. By 2010, potential exceeded Myanmar’s actual exports by a factor of more than four.
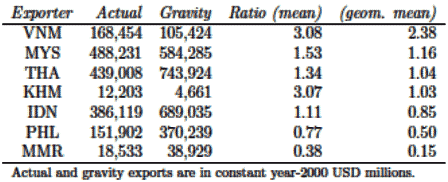
Compared to other ASEAN countries, Myanmar ranks lowest in terms of the ratio of actual to gravity exports (Table 1). During 2006-2010, this ratio averaged only 0.38 across Myanmar’s trading partners. Weighing outliers, such as exports to Thailand, the geometric mean of Myanmar’s actual-to-potential exports ratio turns out even lower, at 0.15. That is, Myanmar exploited only 15% of its (gravity) export potential in the five years to 2010.
Table 1: Actual and Gravity Exports (2006-2010)
Source: author’s calculations.
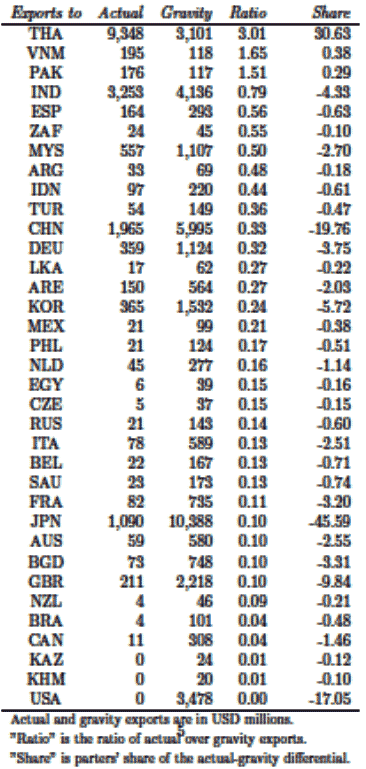
Myanmar’s exports during 2006-2010 fall substantially short of potential for all destinations but Thailand, Viet Nam and Pakistan (Table 2). Myanmar’s actual/gravity ratio in relation to Thailand exceeds 3, and for the other two markets is about 1.5. While trade with all three countries contributes positively to closing Myanmar’s gap to potential, only Thailand does so significantly, accounting for nearly 31%.
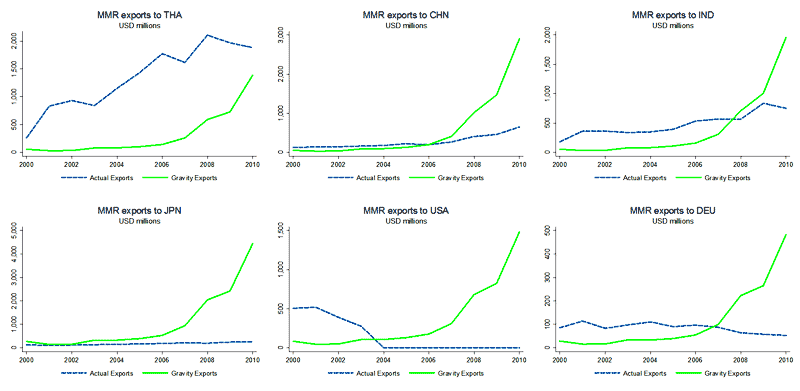
Among the developing countries, the People’s Republic of China (PRC) is the export destination with the largest unexploited potential for Myanmar: 2006-2010 exports to PRC were about one third their potential level and constituted nearly 20% of Myanmar’s total gap to potential (Table 2 and Figure 2).
Table 2: MMR Actual/Gravity Ratio (2006-2010)
Source: author’s calculations.
Figure 2: Actual and Gravity Bilateral Exports Toward Selected Countries
Source: author’s calculations.
Due to exceptionally high natural gas exports to Thailand, developing countries jointly account for less than 10% of Myanmar’s export gap to potential. More than 90% of it is on account of the industrialized countries, particularly Japan (46%), Europe (22%), and the United States (17%). Myanmar’s gradual integration with the world economy and normalized, unsanctioned access to the Japanese, European and American markets may thus be expected to fill this gap rather swiftly.
