Remittances to Asia in 2018: Sources and Costs

As a key source of migrant workers globally, it’s no wonder that Asia receives significant amounts of remittance. This pool of money benefits millions of families and assists recipient economies in achieving the 2030 Sustainable Development Goals. But for all the benefits remittances bring, sending them remains costly. Regional cooperation and integration efforts in Asia could facilitate maximizing the advantages of remittance inflows while working towards reducing the cost of remitting funds via formal channels across the region.
Remittance receipts to Asia hit another record in 2018. Asia received around $302.1 billion in remittances, the largest amount out of the global total of $682.6 billion. Improved economic performance in the United States, the rise in oil prices which resulted in the resurgence in remittances from the Middle East and enhanced economic activity in the Russian Federation were major factors for the increase in remittance flows from major sending countries to Asia. India, the People’s Republic of China (PRC), the Philippines, Pakistan, and Viet Nam were among the top 10 recipients globally (Figure 1)—combined inflows ($216.9 billion) to these five economies accounted for one-third of the world total, underscoring how vital remittances are in directly providing for the consumption, investment and savings needs of households and helping ease poverty in developing Asia. Regardless of volume, remittance inflows matter to many economies in the region. Major labor-source countries such as India, the Philippines, and Pakistan enjoyed large volumes of remittance receipts but even among economies which received smaller total amounts such as Tonga, Samoa, and Tuvalu, remittance inflows remained significant both in per capita terms and as a proportion of GDP.
Figure 1. Top Remittance Recipients in Asia, 2018 ($ billion)
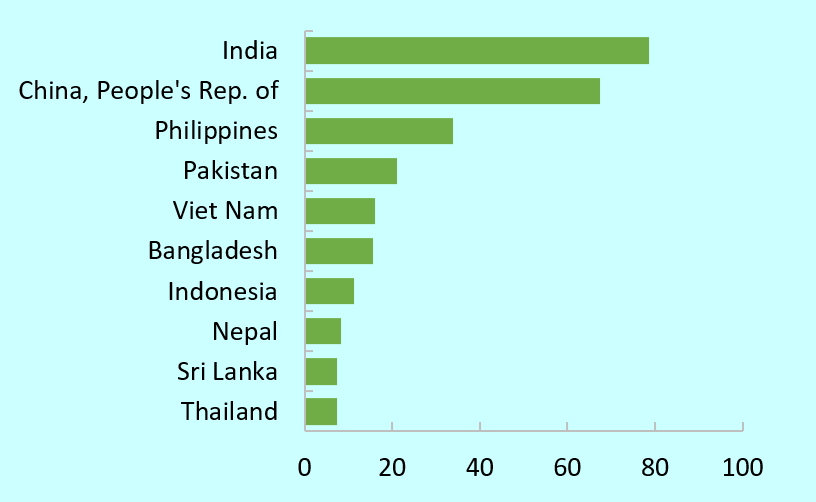
Source: ADB calculations using data from Global Knowledge Partnership on Migration and Development. http://www.knomad.org/data/remittances (accessed December 2019).
The Middle East was the top source region of remittances to Asia but among economies, the US was the top remitter. Remittance flows from world to Asia grew in 2018, raising the region’s remittance pile by $29.7 billion. Asia’s largest source of remittances was (still) the Middle East from which it received $95.4 billion, higher by 13.3% ($11.2 billion) than in 2017 (Figure 2). Almost all outflows from the Middle East went to two Asian subregions, South Asia (83.0%) and Southeast Asia (16.6%)—around 50% (est. 21 million) of migrants from South Asia and 20% (est. 4 million) from Southeast Asia are in the Middle East. India, Pakistan, and the Philippines received a total of $72.2 billion, equivalent to 75.8% of Middle East outflows to Asia and 52.4% of its outflows to the world. Although South Asia and Southeast Asia received the most remittance inflows, these subregions are also subjected to swings in economic performance and labor policies of some Middle East economies which have increasingly tended to promote the hiring of domestic labor.
Inflows from North America and Europe also increased by $2.7 billion and $4.2 billion, respectively. Remittances from North America ($71.8 billion) accounted for 23.8% share of total inflows to Asia which were distributed to Southeast Asia (37.2%), East Asia (33.5%), and South Asia (27.9%). The PRC, India, and the Philippines received $49 billion in total, equivalent to 68.2% of North America’s total remittances to Asia. Inflows from Europe, grew to $42.5 billion, up by 11% from 2017. Led by outflows from the United Kingdom (UK) and the Russian Federation, the top subregion recipients were South Asia (esp. India and Pakistan) and Central Asia (Uzbekistan, the Kyrgyz Republic, and Tajikistan). Countries within Asia also contributed to the rise in remittance inflows—collectively $11.0 billion more in 2018—as Asia’s intraregional remittance share improved to 28.6% from 27.7% in 2017. By economy, Hong Kong, China and Australia were among the top sources of remittance inflows to the region (Figure 3). The other eight countries, led by US, were outside Asia and contributed $177 billion or 58.6% of the total remittances Asia received.
Figure 2: Remittance inflows to Asia by source region
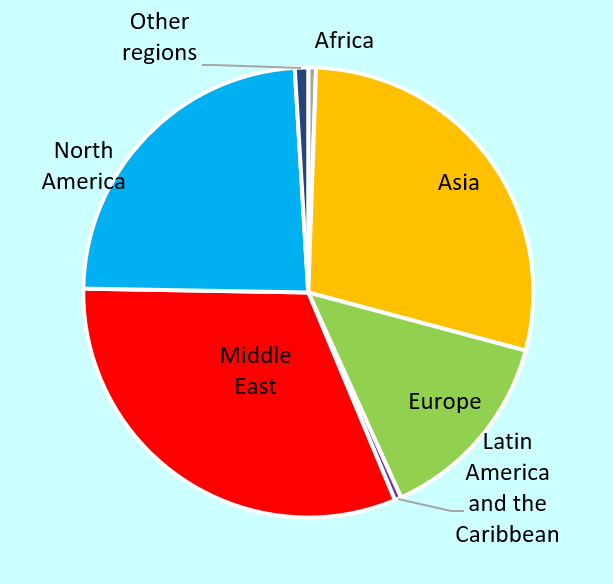
Figure 3: Top 10 sources of remittances to Asia
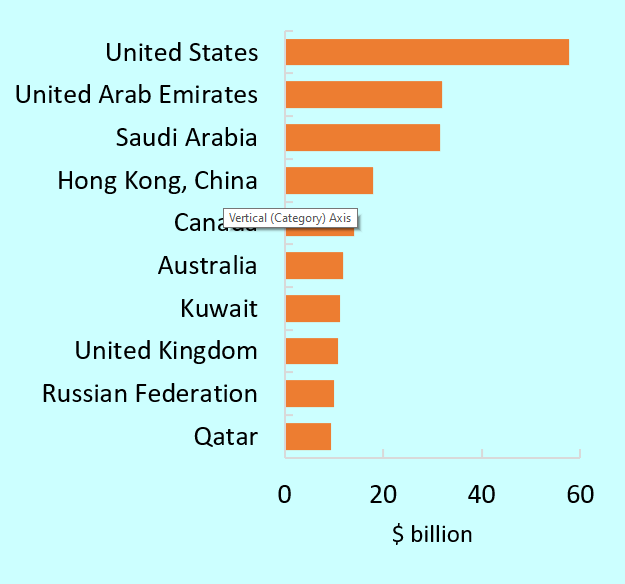
Source: ADB calculations using data from Global Knowledge Partnership on Migration and Development (KNOMAD). http://www.knomad.org/data/remittances (accessed December 2019).
In general, Asia depends outside the region for majority of its remittances, but profiles by subregion vary. Around 29% ($86.4 billion) of inflows to Asia were from migrant host countries within the region—some 68% of these flows were from East Asia and Southeast Asia; another 30% came from Oceania and South Asia. By economy, the largest sources of inflows to the region were Hong Kong, China, Australia, Japan, Malaysia, and Singapore. Among subregions, the Pacific stands out in its dependence on Asia for around 60% of its remittances (Figure 4). Timor-Leste, Papua New Guinea, Solomon Islands, and Tuvalu relied on Asian countries as a source for at least 80% of remittances received, mostly from Australia and Indonesia.
Relative to 2010, Central Asia (91.2%), South Asia (85.7%) and Oceania (61.0%) received higher proportions of remittances from outside Asia, on account of the bulk of migrant workers from these subregions being employed mostly in the Russian Federation, the United Arab Emirates, Saudi Arabia, the US and the UK. East Asia’s remittance inflow profile for 2010 and 2018 hardly changed—47.4% of its remittances were from non-Asian sources. Over the same period, the region has become an improved source of remittances for Southeast Asia and East Asia.
Figure 4. Subregional remittance sources in Asia (%)
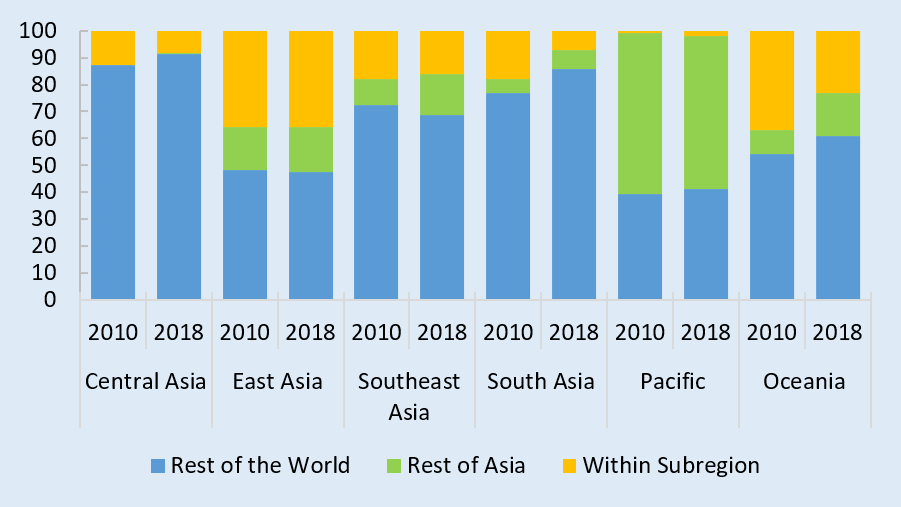
Source: ADB calculations using data from Global Knowledge Partnership on Migration and Development (KNOMAD). http://www.knomad.org/data/remittances (accessed December 2019).
Globally, the average cost of sending remittance had declined marginally between 2017 and 2019 but remained particularly high in the Pacific. As of the last quarter of 2019, the global average cost of sending a $200-cash remittance was 4.8% to South Asia and 6.3% to Southeast Asia. Sending the same amount to the Pacific subregion where banks have limited correspondent bank accounts upped the cost to 9.4%, higher than the 7.0% global average (Figure 5). Costs also varied by destination and service provider—a $200-cash transfer from the Middle East cost 3.9% to send to India and 3.5% to Sri Lanka; a similar transaction from Australia to Samoa cost 21.6% via banks and 9.4% via money transfer operators. Efforts to bring down remittance costs have been initiated on a country level, as in the case of the Bangladesh Bank’s giving a 2% cash incentive to encourage non-resident Bangladeshis to use banks in sending remittances and the National Bank of Pakistan’s agreement with the Pakistan’s Post Office Department to allow remittance recipients to collect their remittances from any of the 500 Pakistan Post locations.
Figure 5. Average cost of sending $200 in cash by recipient region (%)
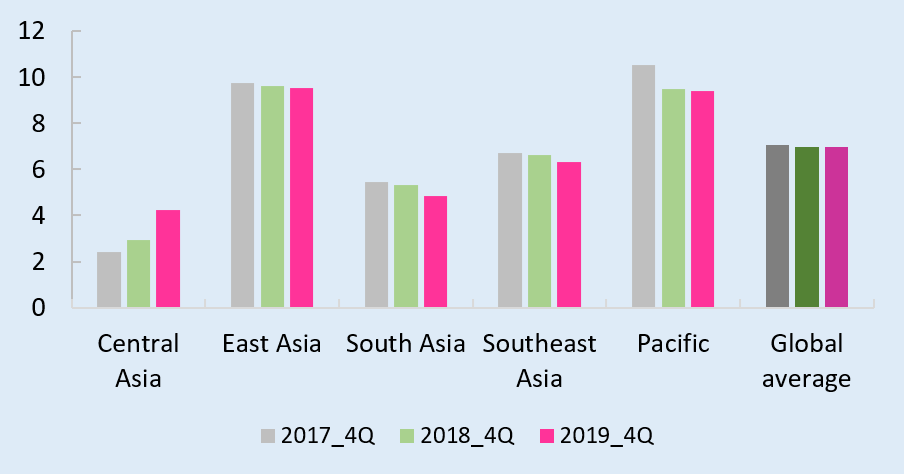
Note: Data refer to the following economies per subregion: Armenia, Azerbaijan, Georgia, Kazakhstan, Kyrgyz Republic, Tajikistan and Uzbekistan for Central Asia; the People’s Republic of China for East Asia; Afghanistan, Bangladesh, India, Nepal, Pakistan and Sri Lanka for South Asia; Cambodia, Indonesia, the Lao People’s Democratic Republic, Malaysia, Myanmar, the Philippines, Thailand and Viet Nam for Southeast Asia; and Fiji, Samoa, Tonga and Vanuatu for the Pacific.
Source: ADB calculations using data from World Bank. Remittance Prices Worldwide. http://remittanceprices.worldbank.org (accessed January 2020).
On a regional level, more can be done. Bringing down the cost of remittances could substantially increase disposable income and produce significant welfare impacts on households in recipient economies —a major reason why lowering the cost of remittance transfers to 3% by 2030 has become one of the United Nations Sustainable Development Goals. Regional cooperation initiatives may be promoted by tapping enabling technology such as blockchain to facilitate more opportunities for partnerships between recipient economies and financial services networks to deliver remittance flows more cost efficiently, especially in regions where countries exhibit diverse pattern of financial development. By working together towards reducing average remittance costs, the region could also collectively bring more remittance transactions into the fold of formal finance and help further financial inclusion.
*