Logistics development in Asia with the USA and Europe
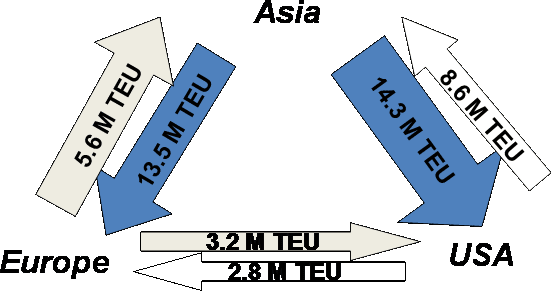
In terms of container export flows, the Peoples' Republic of China (PRC) has been outpacing both manufacturing exporters, the USA and Europe for years. For example, the PRC was dominating in a very significant manner before the credit crunch took place during 2008-2009 (United Nations, 2006 & 2009). Actually between 2004 and 2007, full containers (most of them originating from the PRC) were triple in terms of volume compared to those originating for the USA. This imbalance was lessened after the 2008 crisis, and in 2010 the USA exported 8.6 million full TEUs, while Asia exported to the USA 14.3 million TEU (United Nations, 2011). One of the possible reasons that led to this improvement for the US trade balance has been the appreciation of Yuan. This is, however, not apparent in trade statistics measured in USD – maybe Asian goods are becoming higher priced in US markets.
Europe’s export performance was much better compared to the USA against that of the PRC actually in 2004 Europe exported 8.4 million TEUs to Asia, whereas Asia exported 5.6 million TEUs to Europe. This favorable situation could be partly explained by the huge investment activity and factory projects of European companies in Asia (and particularly the PRC) during that period. However, when these factories were completed, then surplus changed direction from Europe to Asia and the PRC in very short time. In 2007, Asia was already exporting 17.7 million TEUs to Europe, while Europe exported 10 million TEUs (United Nations, 2009). Thereafter, Asian has dominated in exports, as has been the case with the USA.
Figure 1: Container amounts and flows among Asia, Europe and the USA for 2010
Source: United Nations (2011)
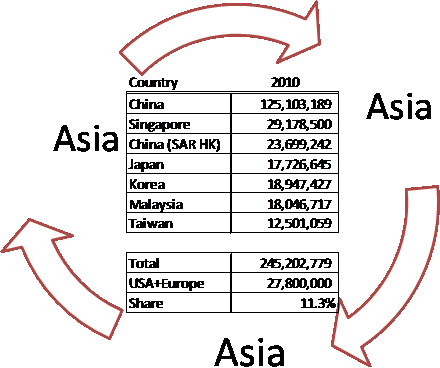
If the intercontinental perspective of container flows is ignored, and focus is laid on the internal Asian container markets, the bigger picture becomes much clearer. As Figures 1 and 2 illustrate, European and USA container volumes are just a small fraction of overall container handling when taking into account the trade of the largest Asian countries (in 2010 it was 11.3 % while in 2007 it was 15 %; we have estimated that empty containers will return to Asia). It is not a surprise that Singaporean traders have started to focus on higher value products instead of high volume ones due to the decrease in transshipment volume (Tan & Hilmola, 2012).
Figure 2: Container amounts within Asia as estimated from overall sea port handling and from where continental flows are being deducted.
Source: United Nations (2011) and Containerization International (2011)
Thus, already today Asian economic development issues (e.g. currencies) should be observed from a regional perspective. The Asian dominance and strength based on container flows to the USA and Europe is certainly impressive and without a doubt it is here to stay. Whether Asian countries implement their own currency basket, or base their future on e.g. strong Yuan, is essentially a policy choice they themselves must make. The USA and Europe (and also in part Japan) can no longer return to their previous consumption days fueled by debt financing, and some manufacturing should be returned to these countries in order to be able to recover in the long-term. However, this will not challenge Asian dominance and will not cause continental flows to grow remarkably in the short to medium term. For container markets, we think that Asian countries should focus more on regional trade, which will assist in establishing a strong economic growth area and will assist in the economic growth of the rest of the world.
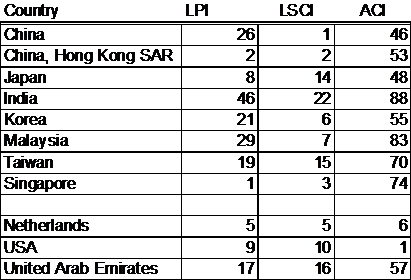
More attention should be given to the development of macro logistics performance by Asian countries, and less to the inevitable currency oriented policies. Currently, shipping connectivity is leading with Asia being the most connected region to the world, while air connectivity is performing poorly. This is clearly seen in Table 1, where a comparison on logistics performance index as well as two connectivity indices of selected Asian countries and three representatives from the West and the Middle East are shown. From an environmental perspective, the low connectivity of airlines is not raising any concerns, but from a supply chain perspective issues such as efficiency and responsiveness are questionable. However, it should be emphasized that Asian countries in general, are performing well in international logistics indexes, when taking into account the level of GDP per capita. In fact, the PRC outperforms the rest of the world together with Malaysia, India and Thailand (Hilmola, 2011). We believe that as Asian currencies gain strength in the future and with an increase in consumption within Asia, the dynamics of containers flow will shift towards Asia. Thus, further research will certainly help to understand this change in dynamics and its impact on international trade.
Table 1. Logistics Performance Index (year 2012) . Connectivity ranks of sea transportation (freight containers, Liner Shipping Connectivity Index, LSCI, year 2011) and air transportation (freight and passenger, Airline Connectivity Index) in selected Asian and other countries.
Source: Arvis et al. (2012), UNCTAD (2012), Arvis & Shepherd (2011)
