Asian Economic Integration Monitor (AEIM)
The AEIM evolved from the Asia Economic Monitor (AEM), which—since December 2001—continued the work of the Asia Recovery Report in monitoring the impact of the 1997/98 Asian financial crisis and policy response. The AEIM expands its coverage to all of Asia and the Pacific.
This semiannual series combines two important elements of ADB�s knowledge portfolio�regional economic and financial monitoring and an assessment of developments in regional cooperation and integration (RCI). Intended to keep track of the region�s progress, the AEIM reviews recent economic performance, assesses new RCI developments in Asia and the Pacific and its subregions.
November 2014
The Asian Economic Integration Monitor is a semiannual review of Asia’s regional economic cooperation and integration. It covers the 48 regional members of the Asian Development Bank. This issue includes Theme Chapter: Regional Financial Integration in Asia and Europe—A Comparative Analysis.
 Cover and Highlights


Part I: Regional Economic Update
Part II: Regional Cooperation and Integration
-
Update on Trade Integration
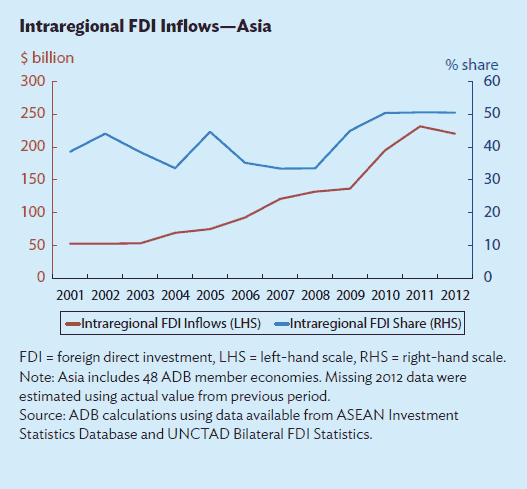
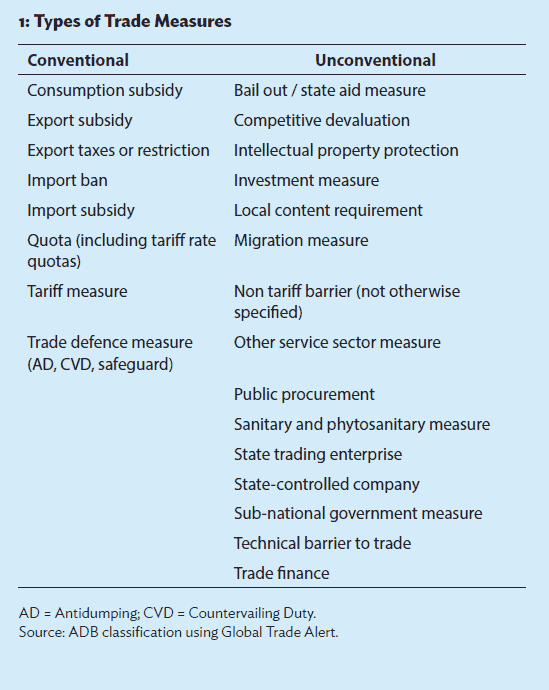
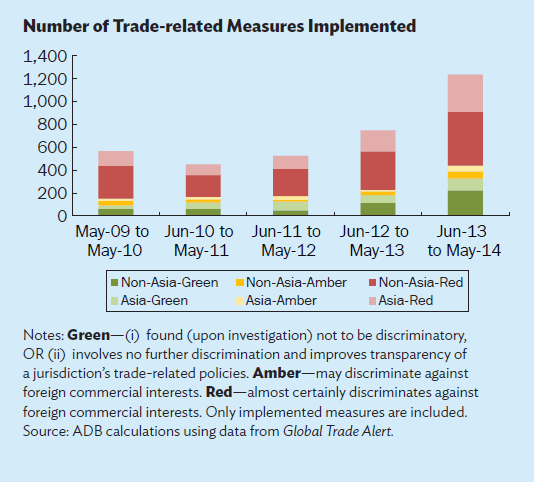
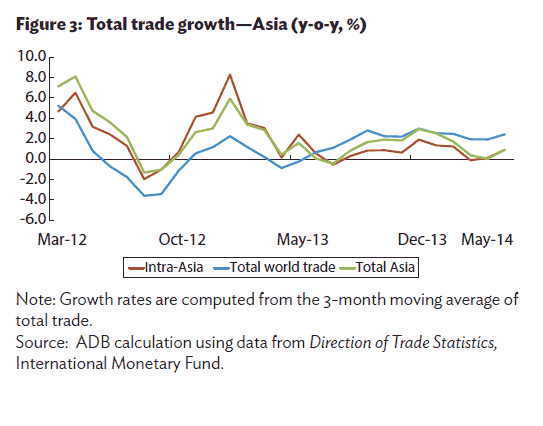
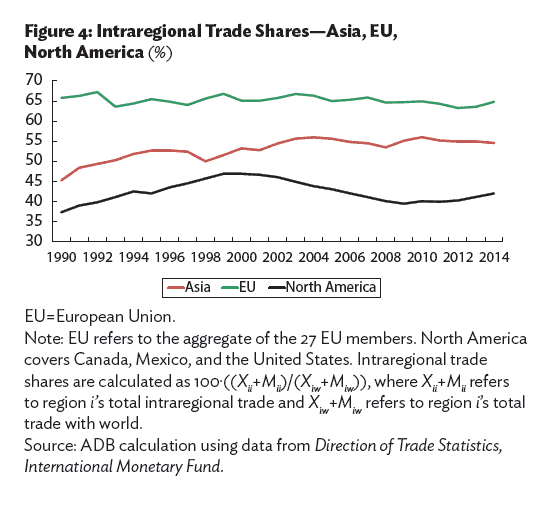
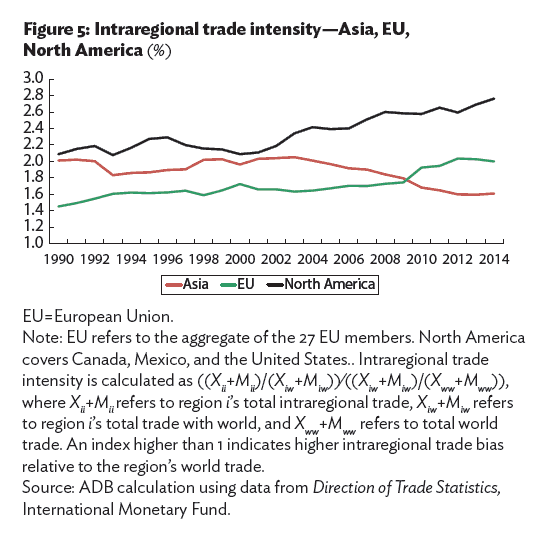
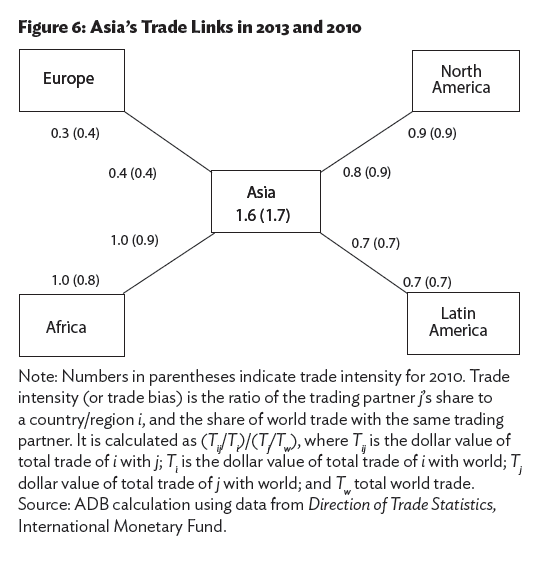
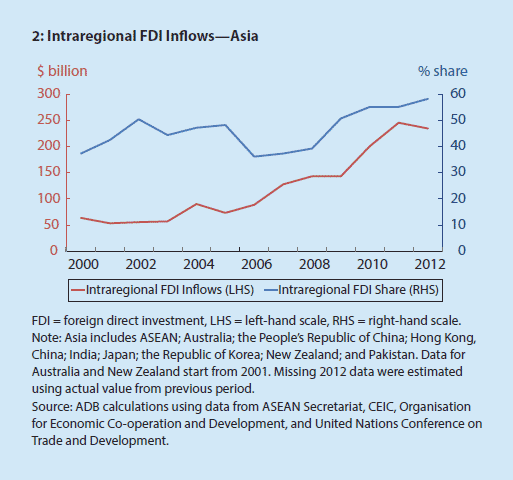
Boxes Chart | Data Box 1: Intraregional FDI Inflows—Asia Chart | Data Box 2: Types of Trade Measures Chart | Data Box 2: Number of Trade-related Measures Implemented Chart | Data Box 2: Top Source and Most Affected Economy Charts Chart | Data Figure 3: Total trade growth—Asia Chart | Data Figure 4: Intraregional Trade Shares—Asia, EU, North America Chart | Data Figure 5: Intraregional trade intensity—Asia, EU, North America Chart | Data Figure 6: Asia’s Trade Links in 2013 and 2010 -
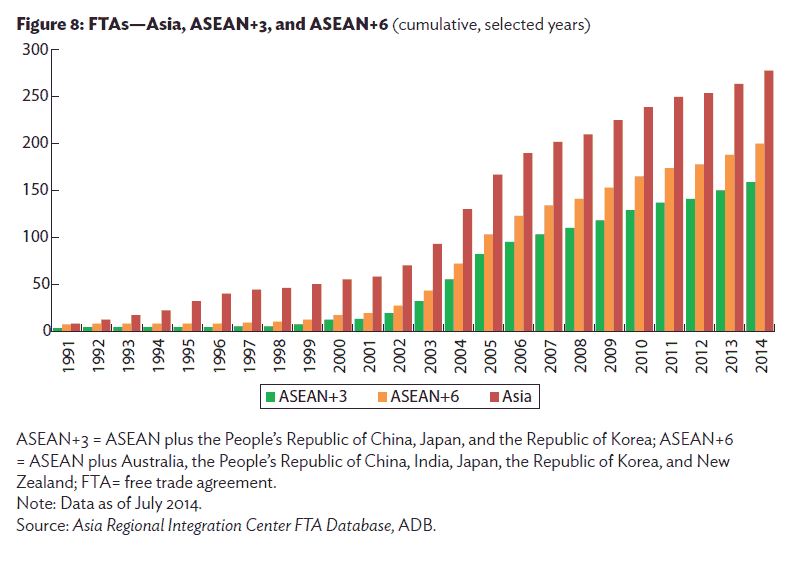
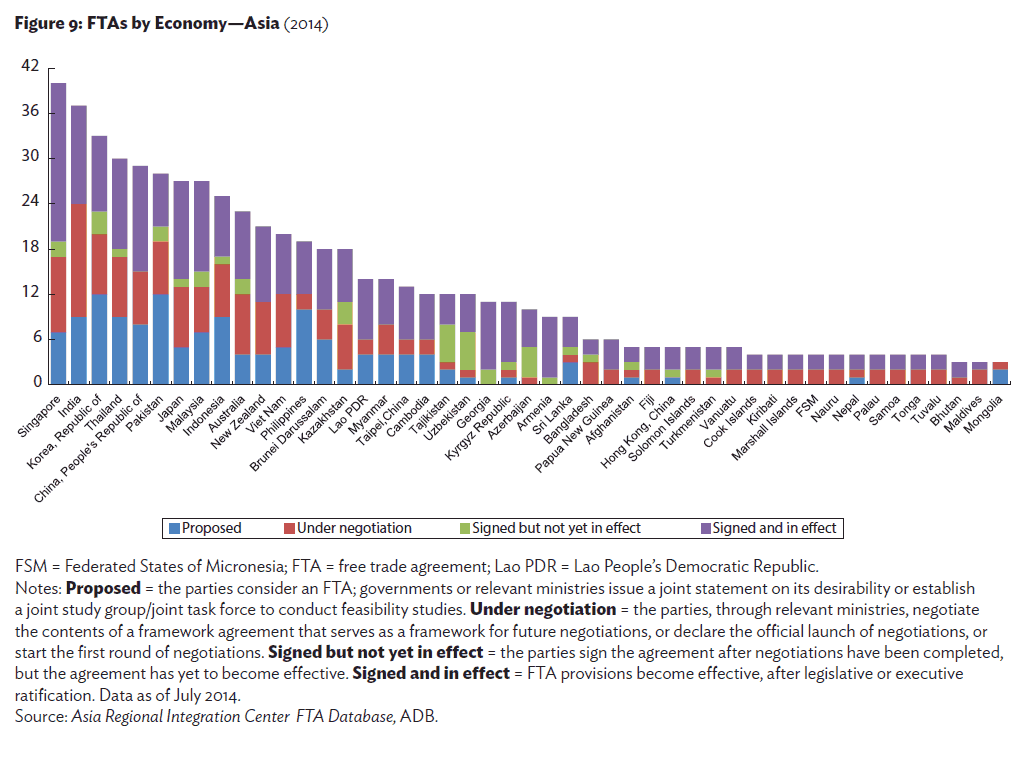
Cooperation on Trade Policy: Asia’s FTAs
-
Update on Financial Integration
-
Developments on Infrastructure Connectivity
-
Update on Labor Mobility
-
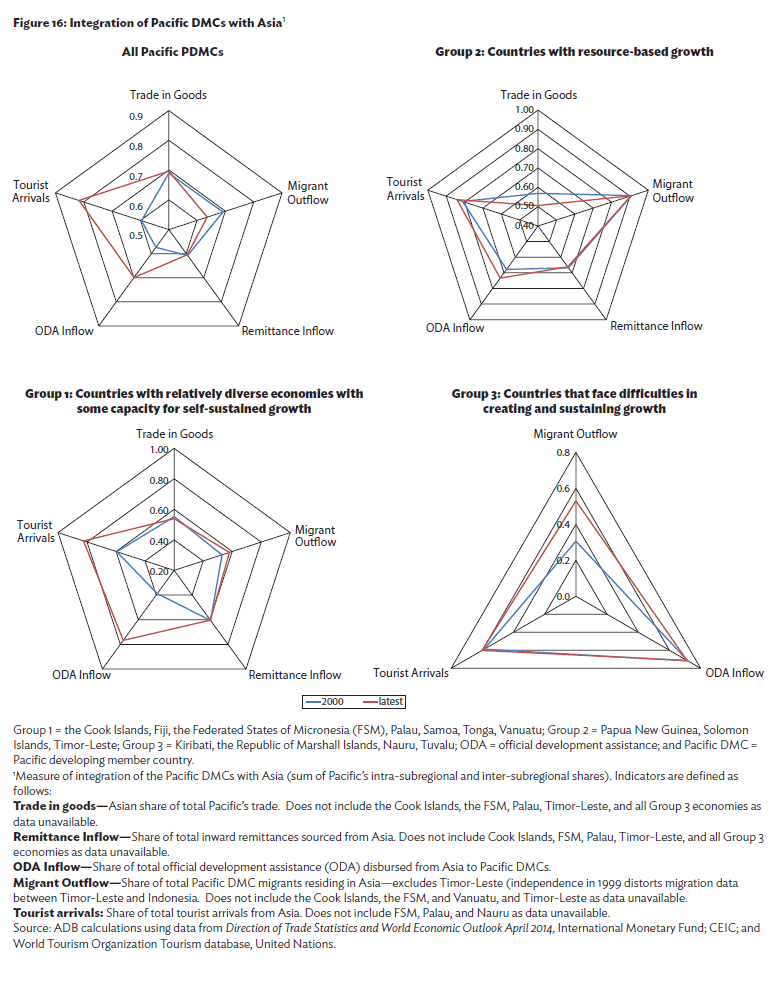
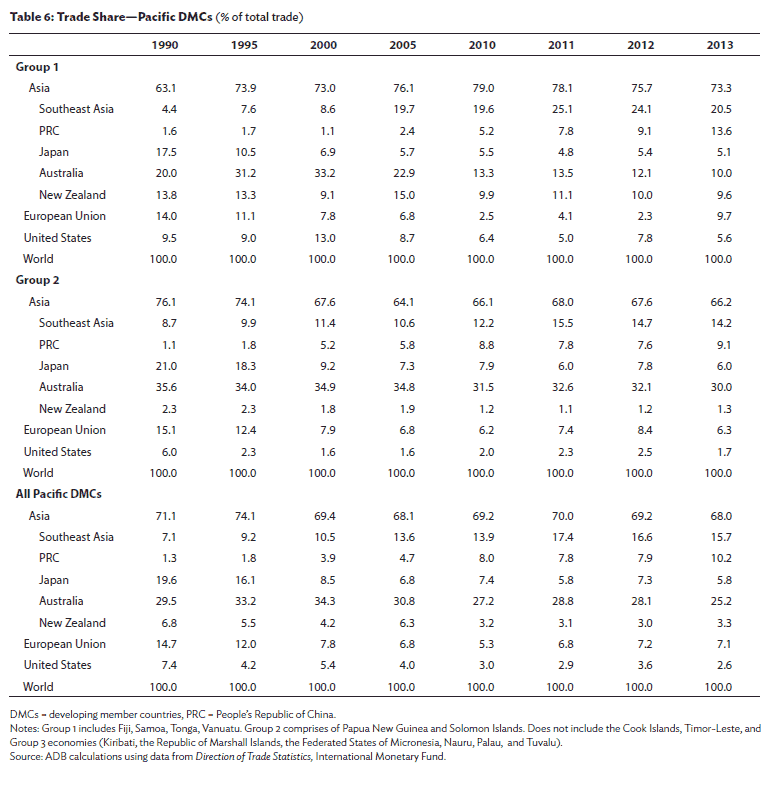
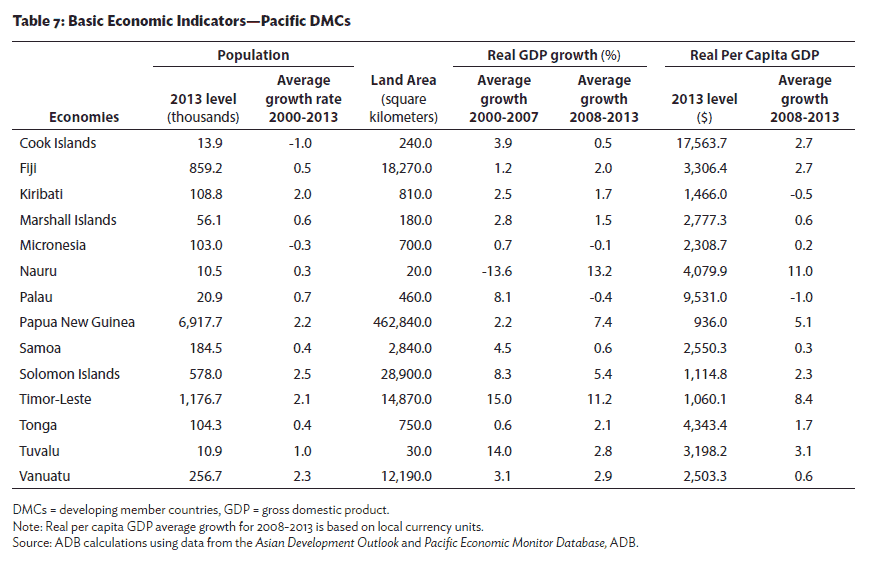
Macroeconomic Interdependence between Pacific
Developing Member Countries and Asia
Special Chapter: Regional Financial Integration in Asia and Europe:
a Comparative Analysis
-
Drivers of Economic Integration
-
Financial Integration and Financial Development
-
Crisis Lessons
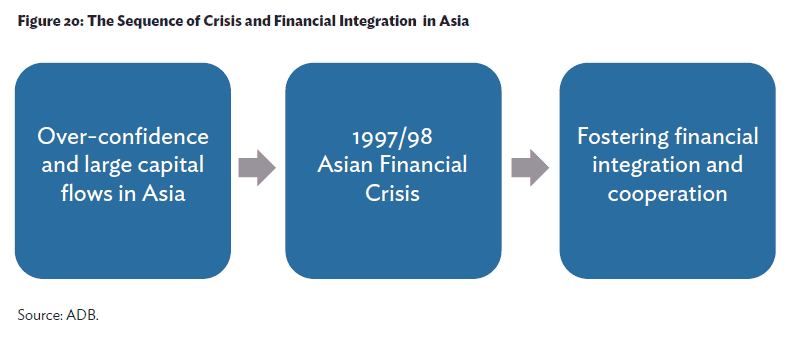
Charts Chart | Data Figure 20: The Sequence of Crisis and Financial Integration in Asia
Statistical Appendix: Regional Integration Tables
| Charts | |
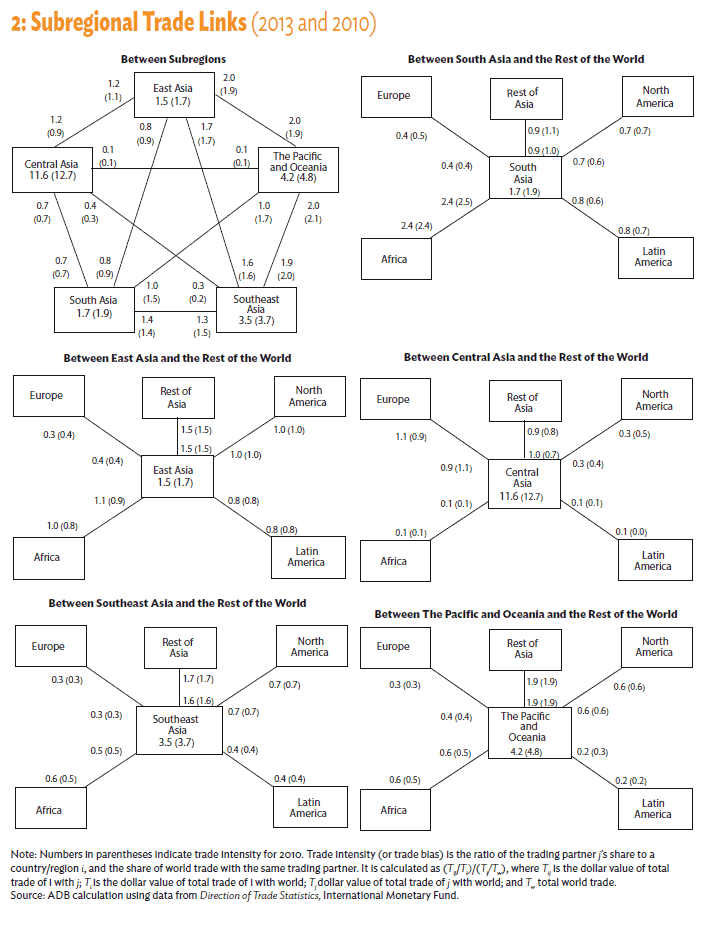
| Chart | Data | Subregional Trade Links | Table |
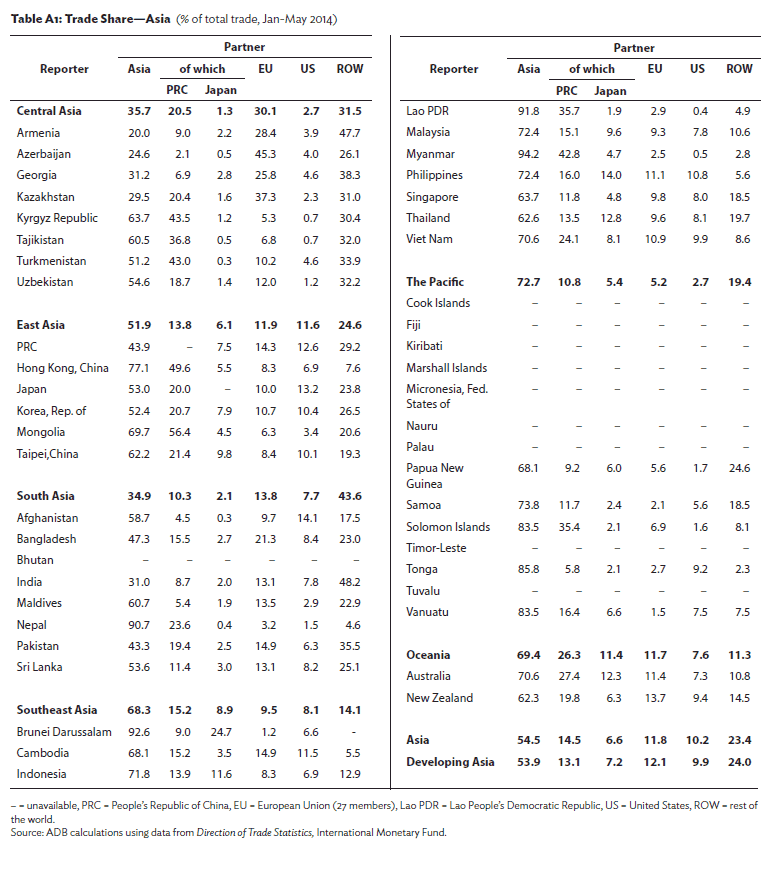
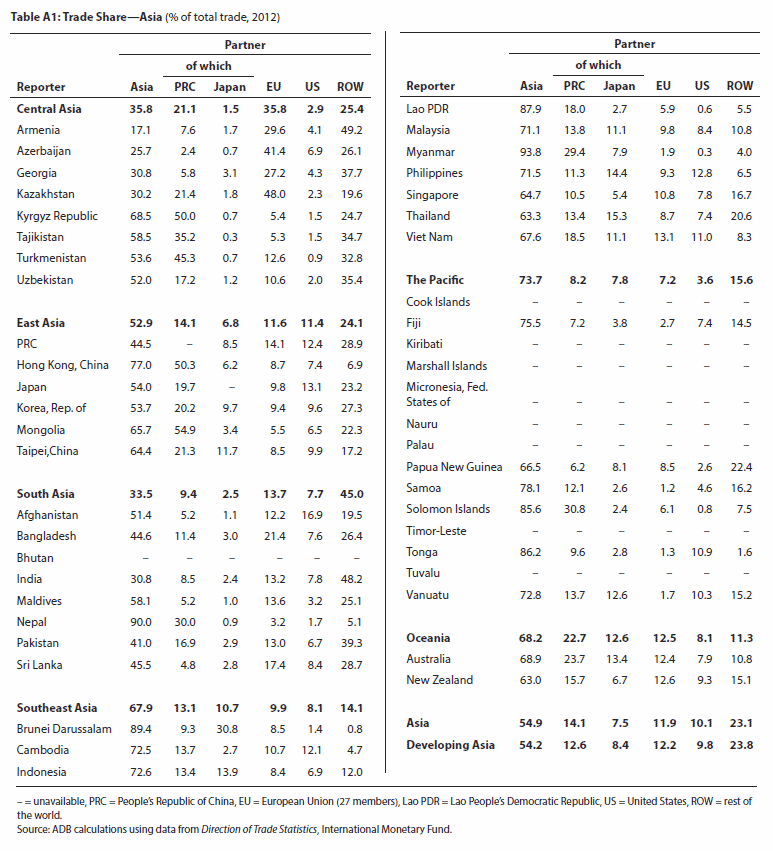
| Chart | Data | Table A1: Trade Share—Asia |
| Chart | Data | Table A2: FTA Status—Asia |
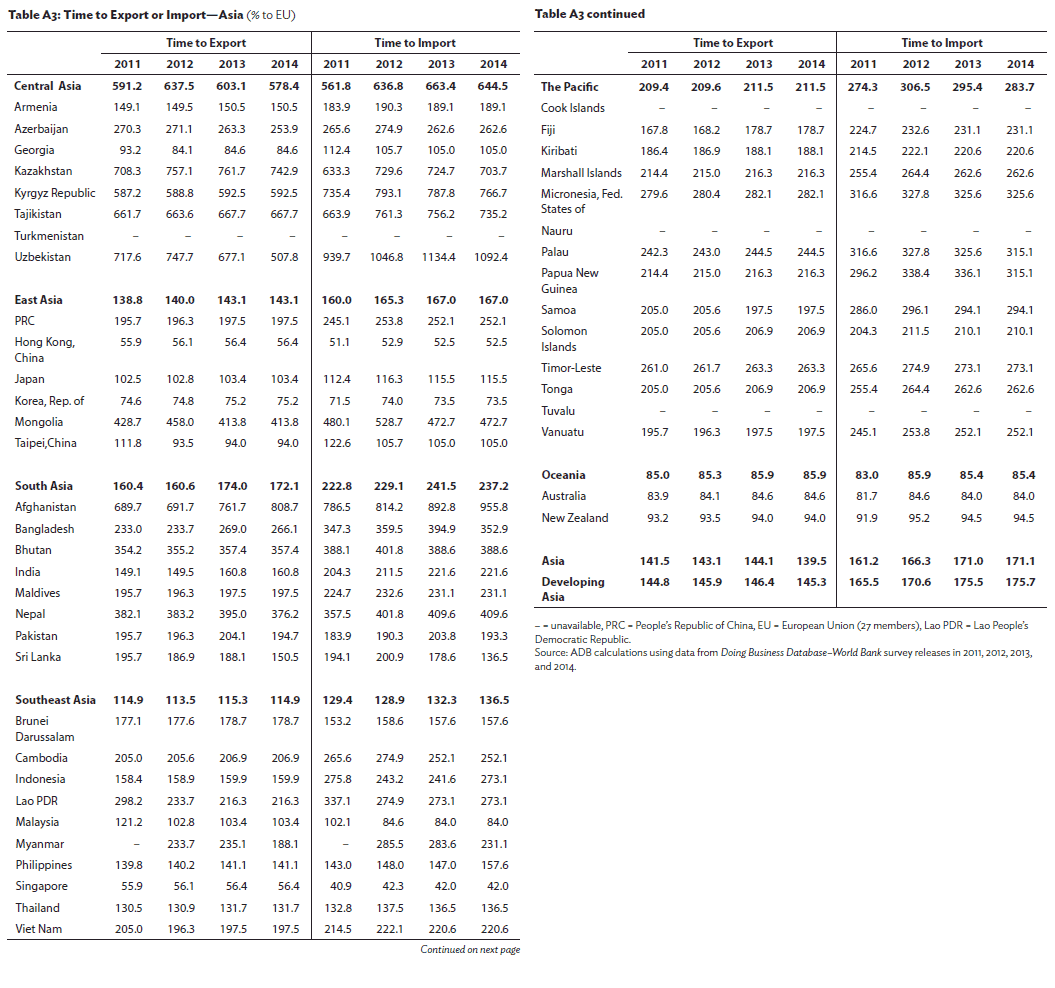
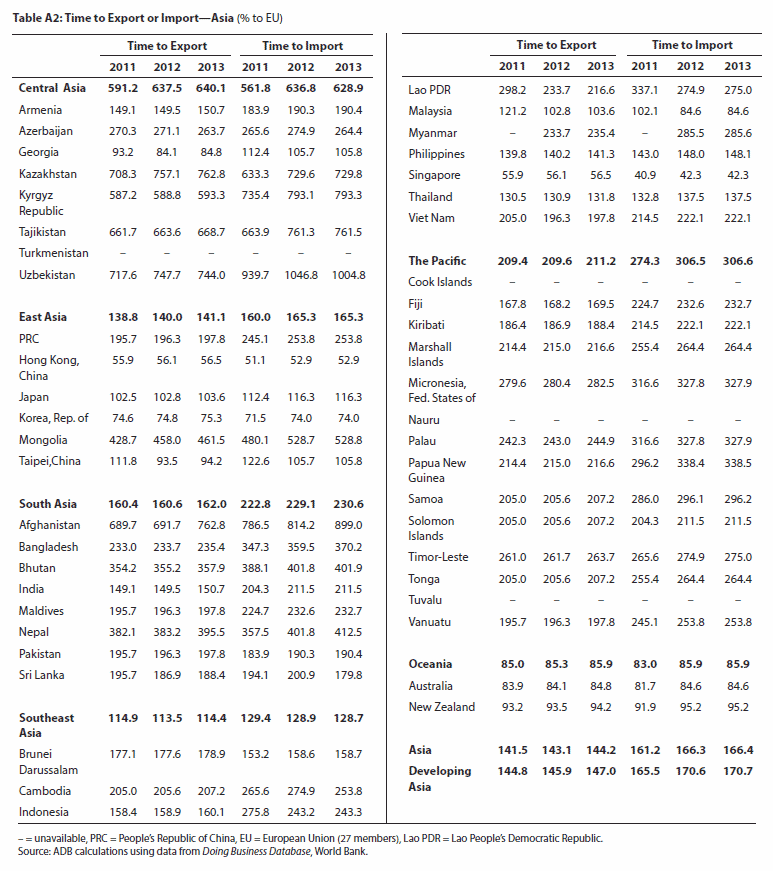
| Chart | Data | Table A3: Time to Export or Import—Asia |
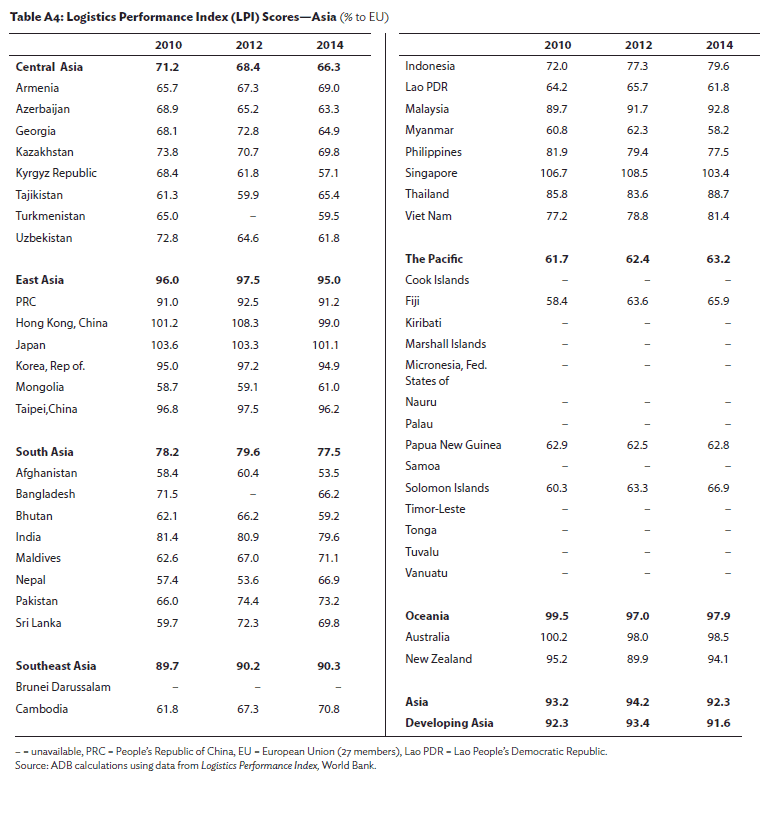
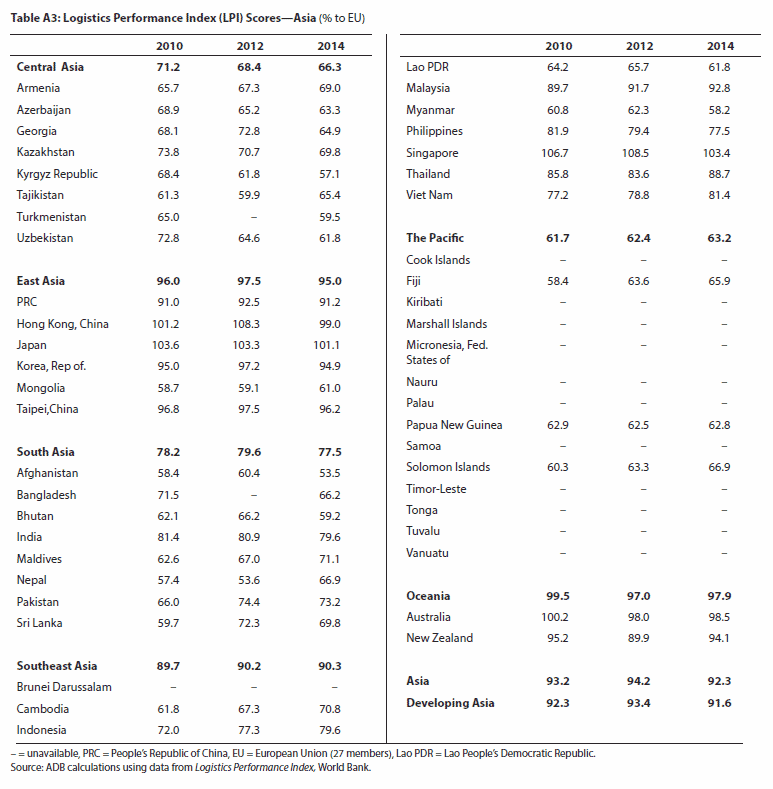
| Chart | Data | Table A4: Logistics Performance Index (LPI) Scores—Asia |
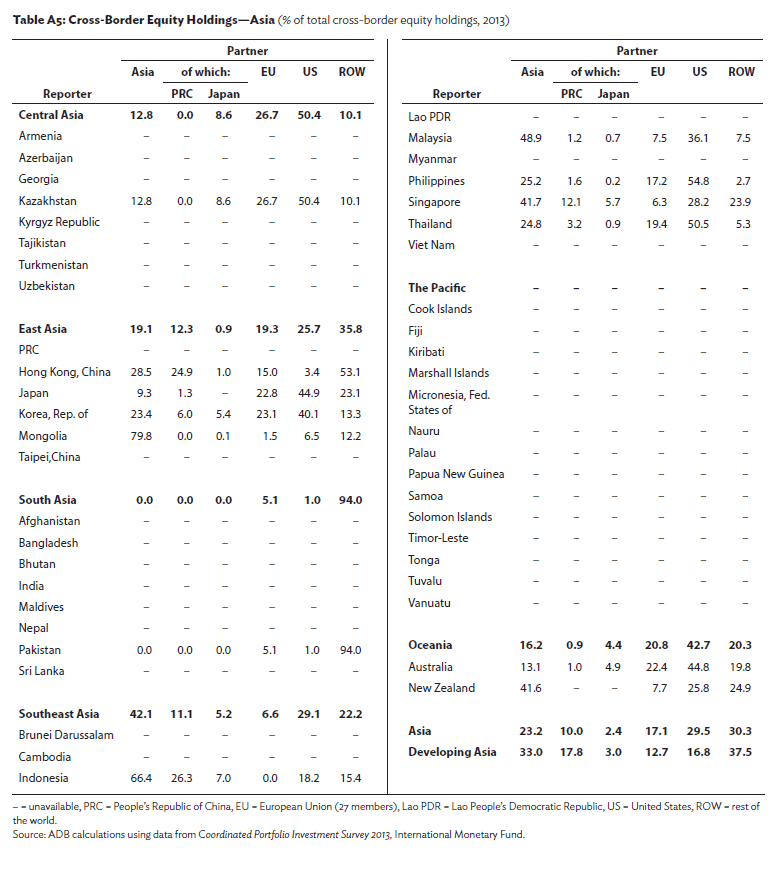
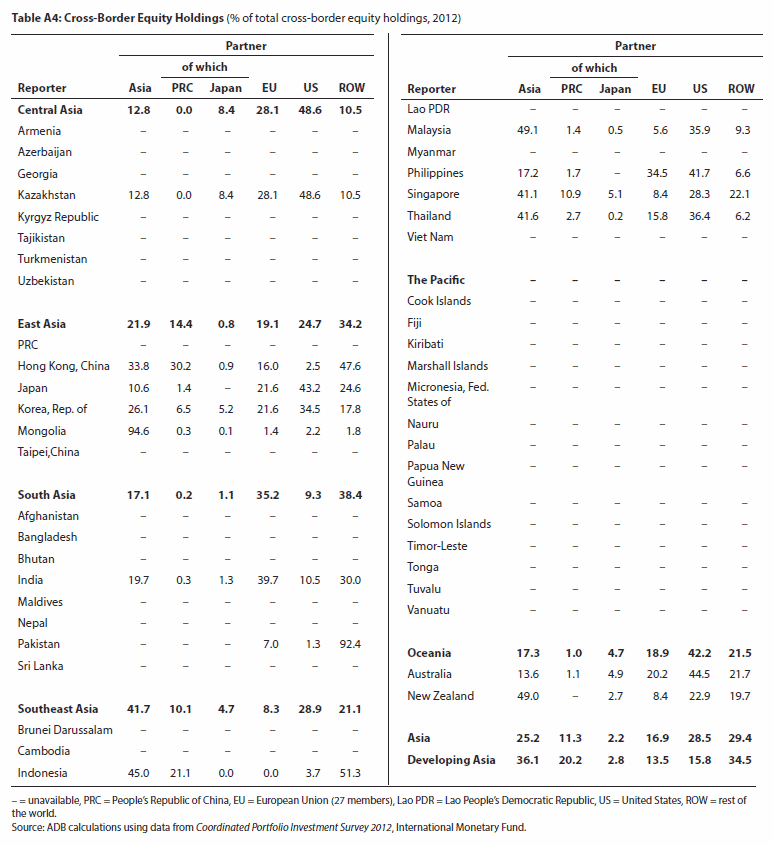
| Chart | Data | Table A5: Cross-Border Equity Holdings—Asia |
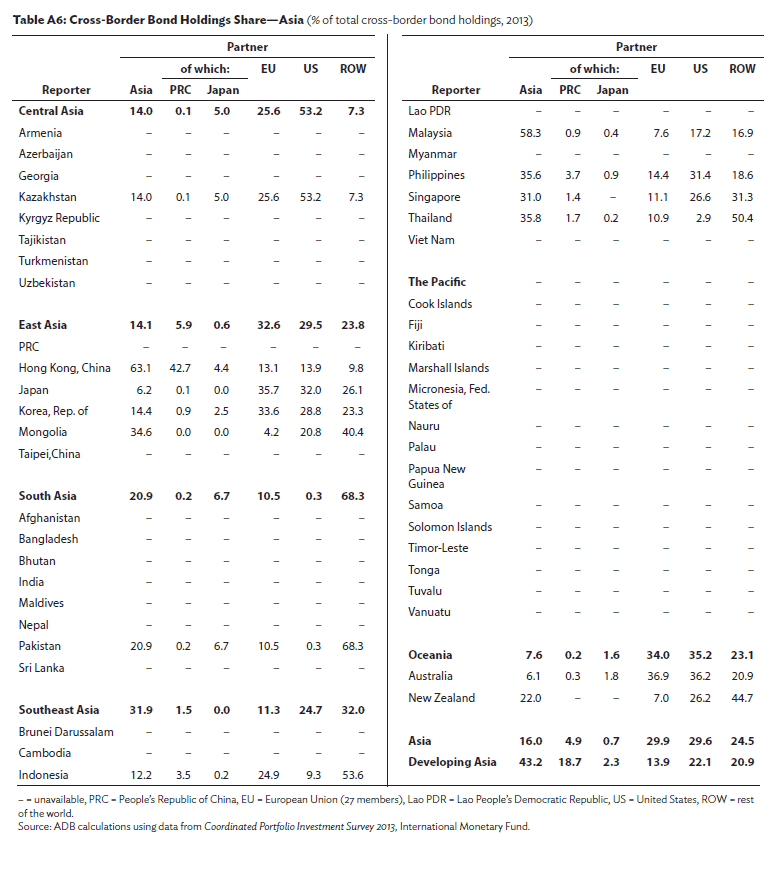
| Chart | Data | Table A6: Cross-Border Bond Holdings Share—Asia |
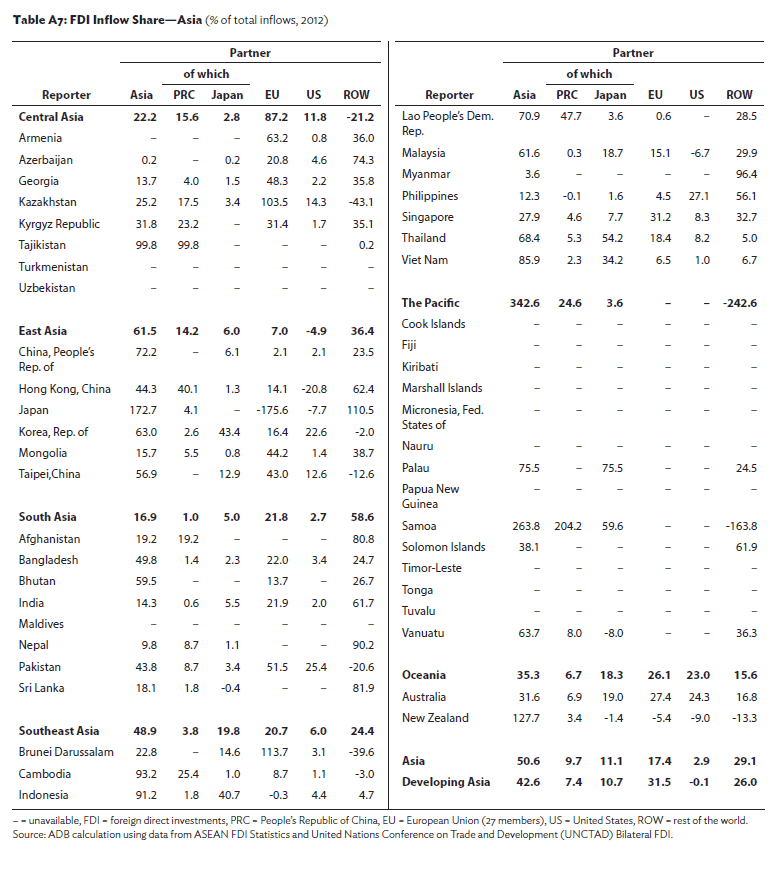
| Chart | Data | Table A7: FDI Inflow Share—Asia |
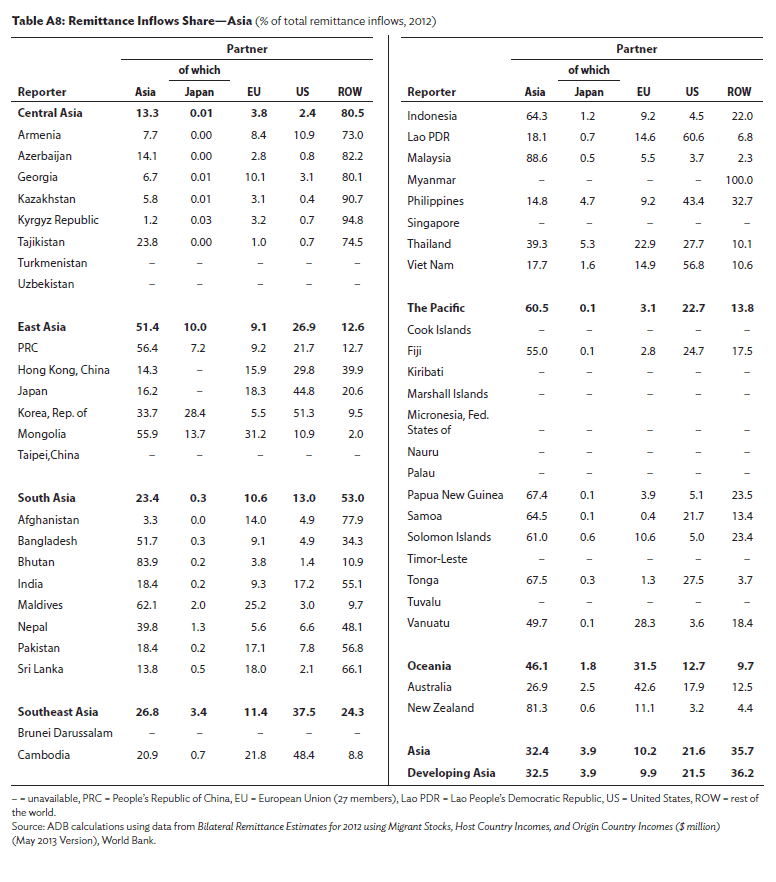
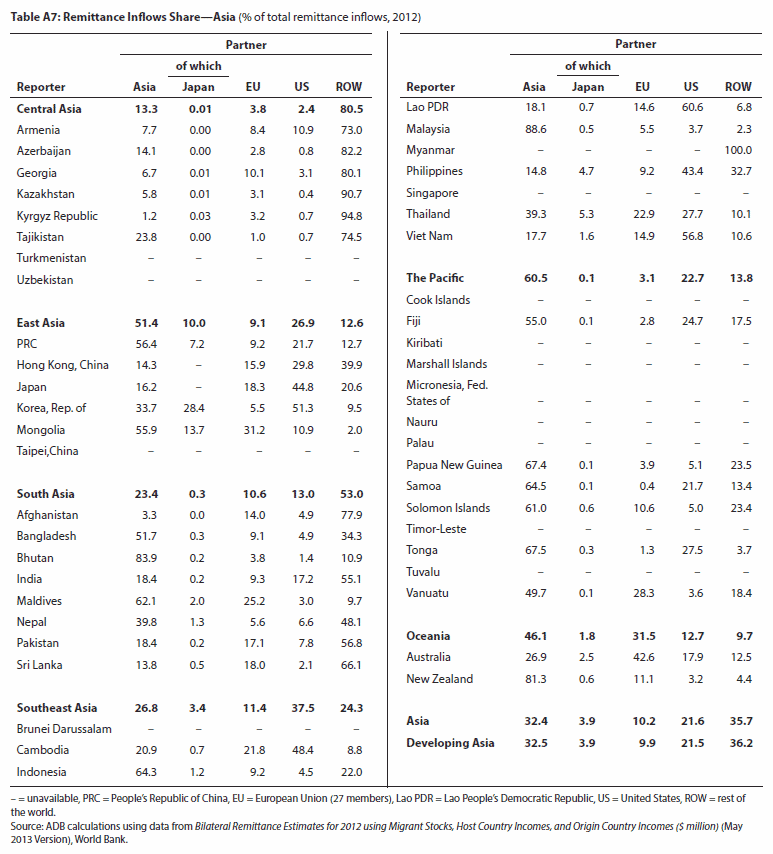
| Chart | Data | Table A8: Remittance Inflows Share—Asia |
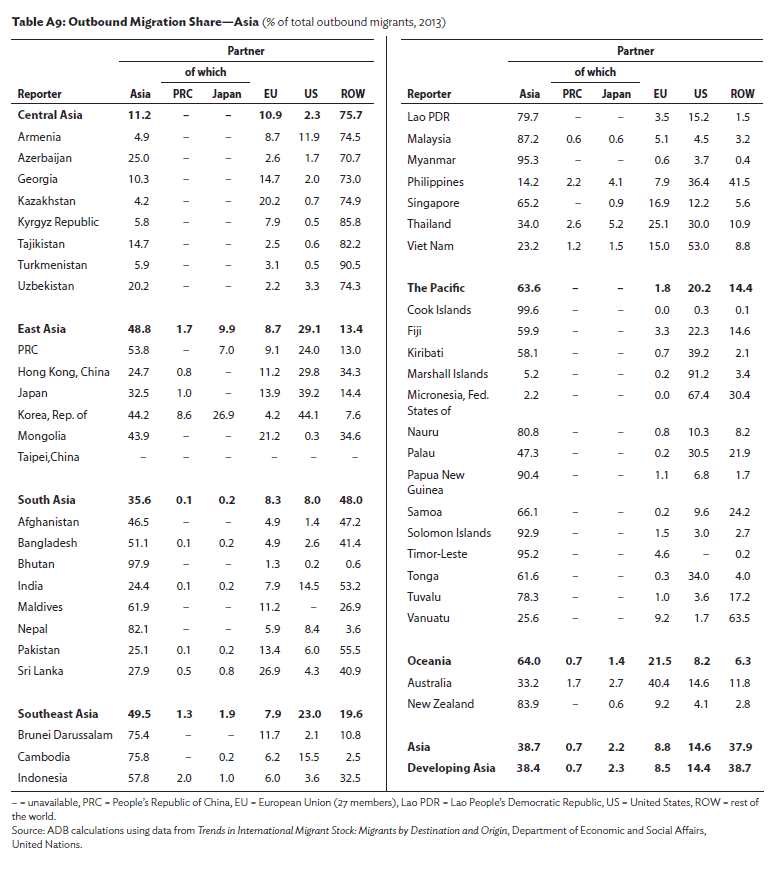
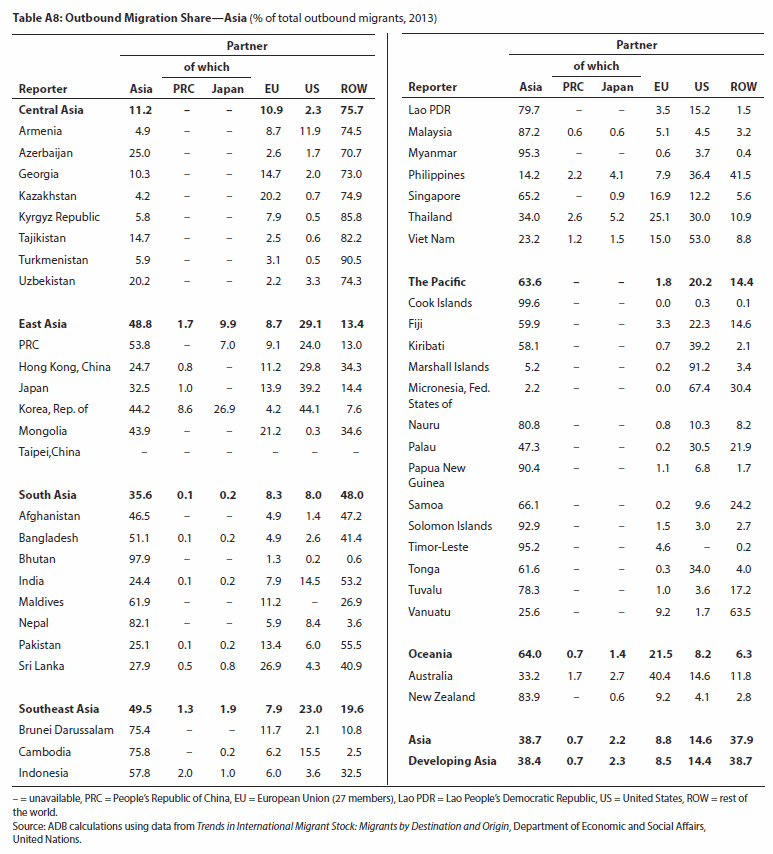
| Chart | Data | Table A9: Outbound Migration Share—Asia |
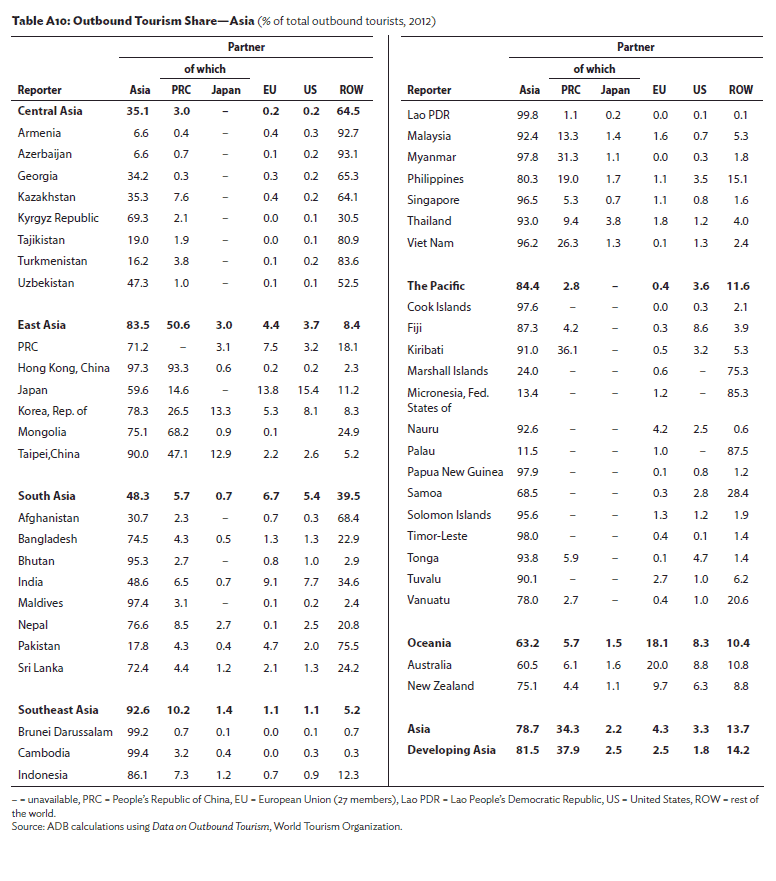
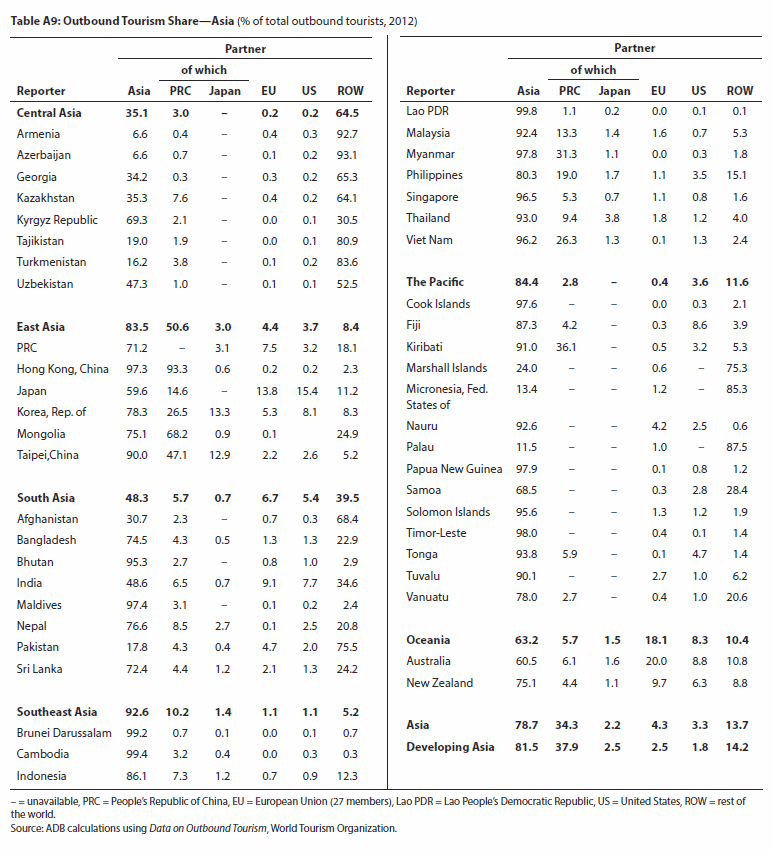
| Chart | Data | Table A10: Outbound Tourism Share—Asia |
Complete Report
April 2014
Cover and Highlights
Part I: Regional Economic Update
-
External Economic Environment
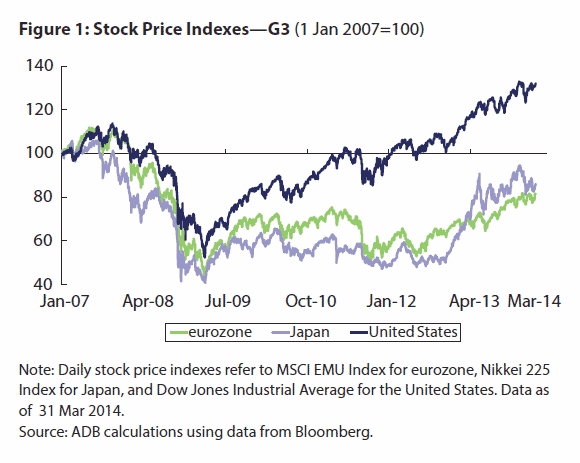
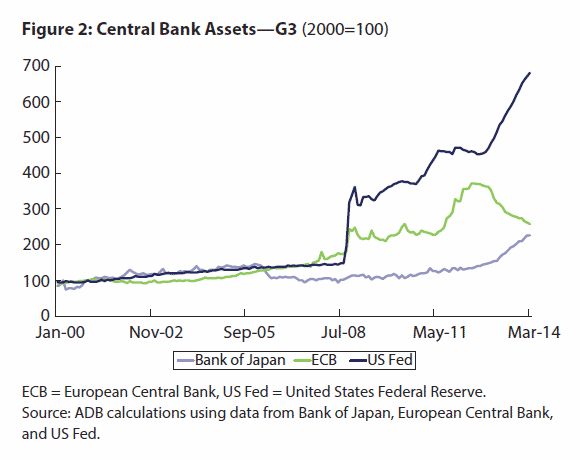
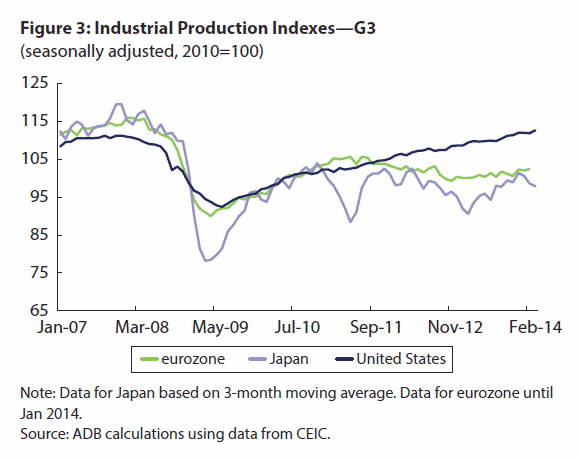
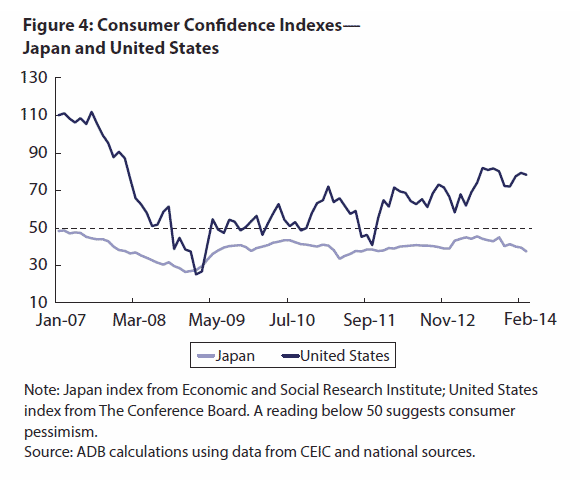
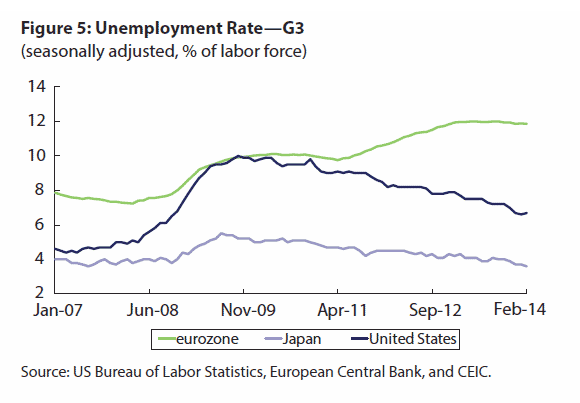
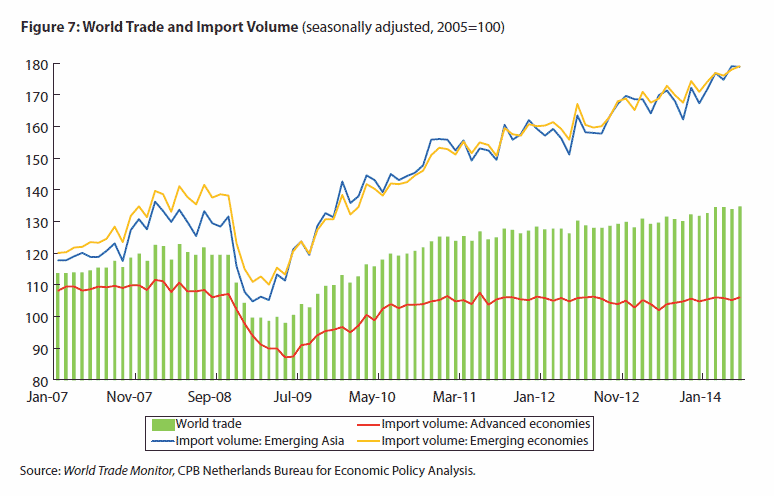
Charts Chart | Data Figure 1: Stock Price Indexes—G3 Chart | Data Figure 2: Central Bank Assets—G3 Chart | Data Figure 3: Industrial Production Indexes—G3 Chart | Data Figure 4: Consumer Confidence Indexes—Japan and United States Chart | Data Figure 5: Unemployment Rate—G3 Chart | Data Figure 6: Retail Sales Growth—G3 Chart | Data Figure 7: World Trade and Import Volume -
Regional Economic Outlook
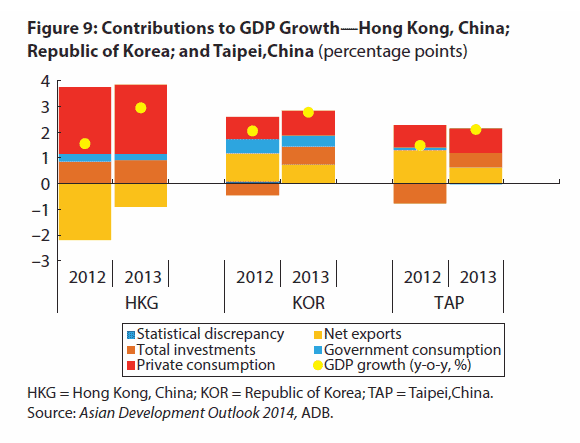
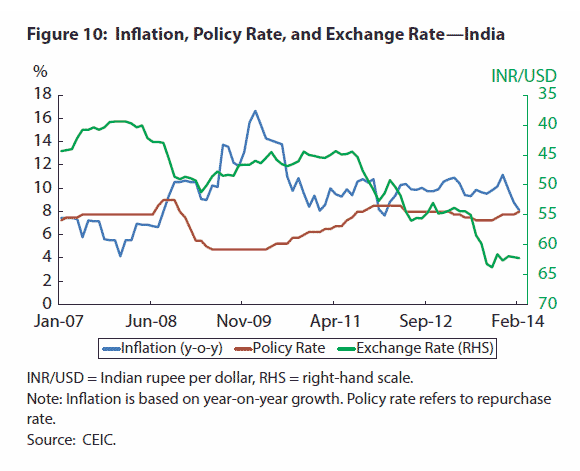
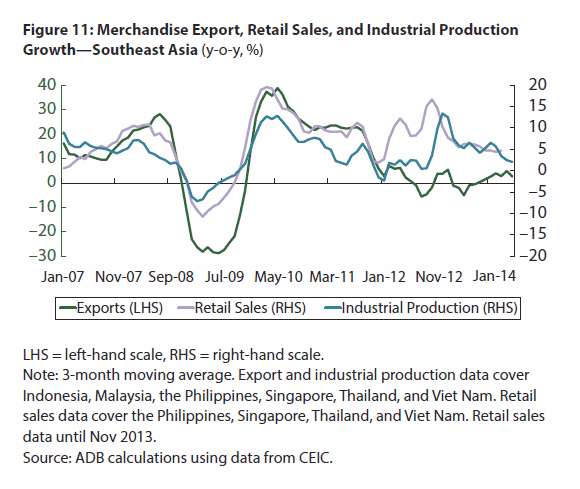
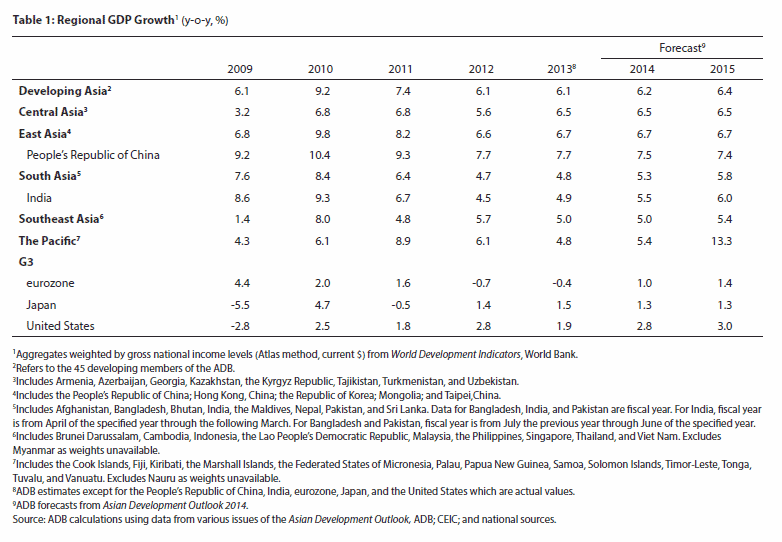
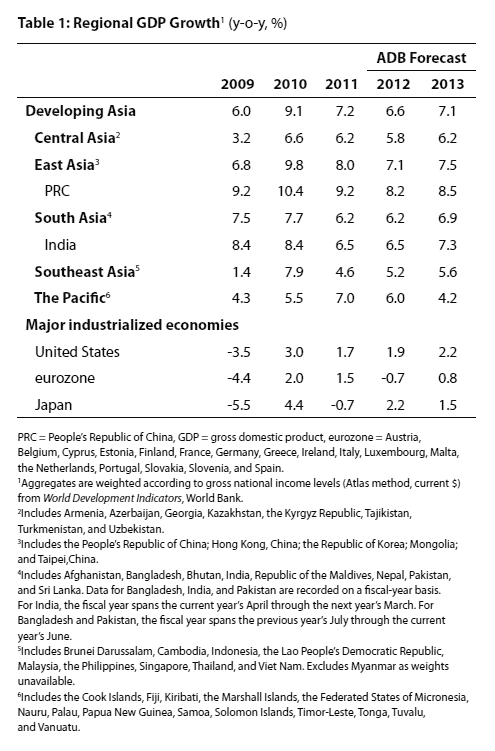
Charts Chart | Data Figure 8: Contributions to GDP Growth—People’s Republic of China Chart | Data Figure 9: Contributions to GDP Growth—Hong Kong, China; Republic of Korea; and Taipei,China Chart | Data Figure 10: Inflation, Policy Rate, and Exchange Rate—India Chart | Data Figure 11: Merchandise Export, Retail Sales, and Industrial Production Growth—Southeast Asia Tables Chart | Data Table 1: Regional GDP Growth -
Risks to the Outlook and Policy Issues
Part II: Regional Cooperation and Integration
-
Introduction
-
Updates on Trade Integration
-
Updates on Financial Integration
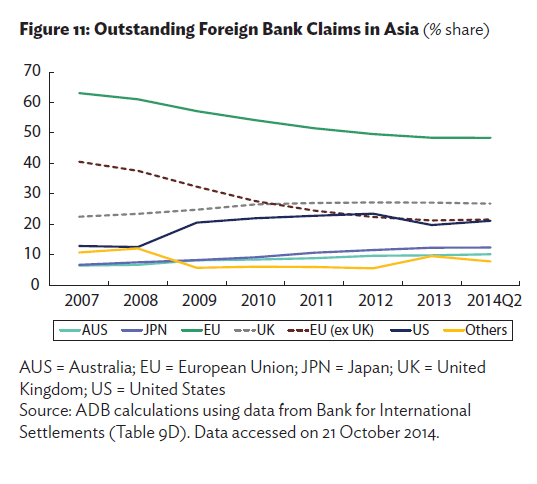
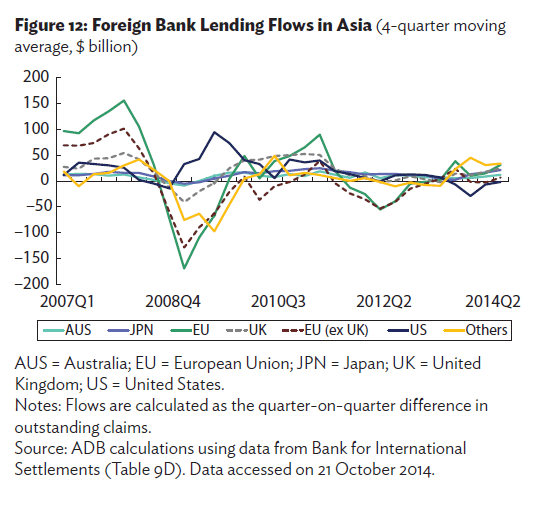
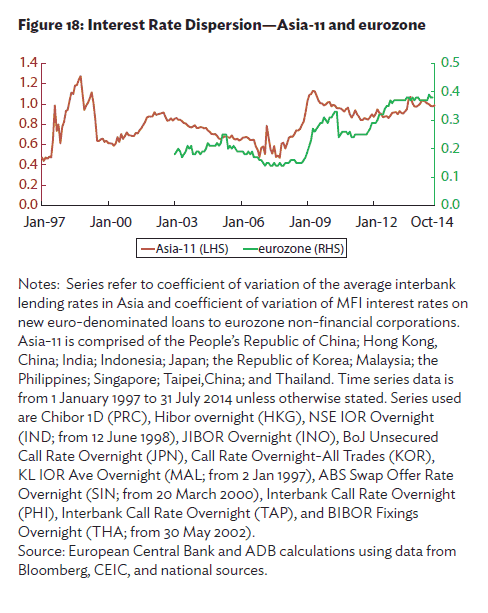
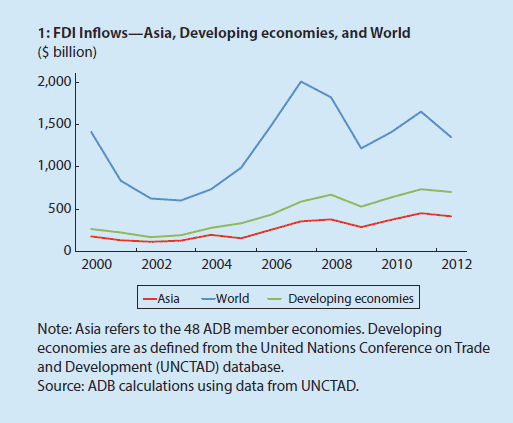
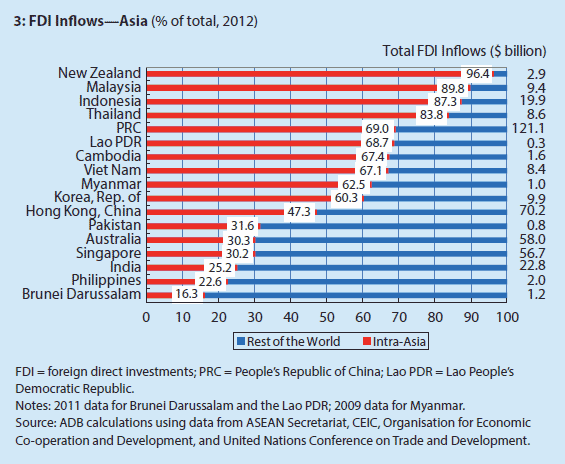
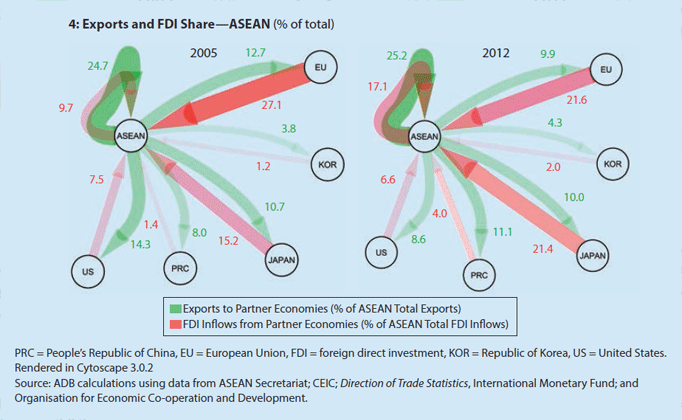
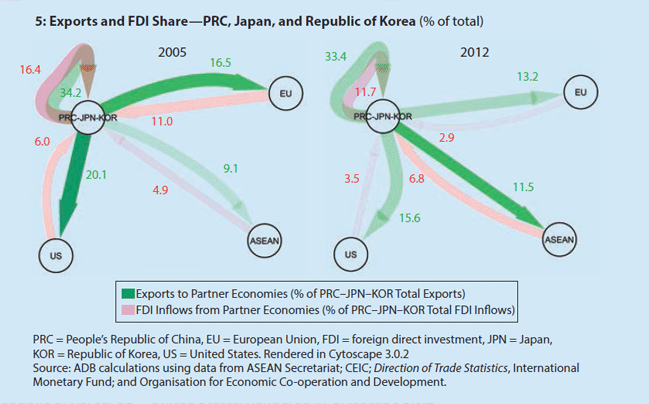
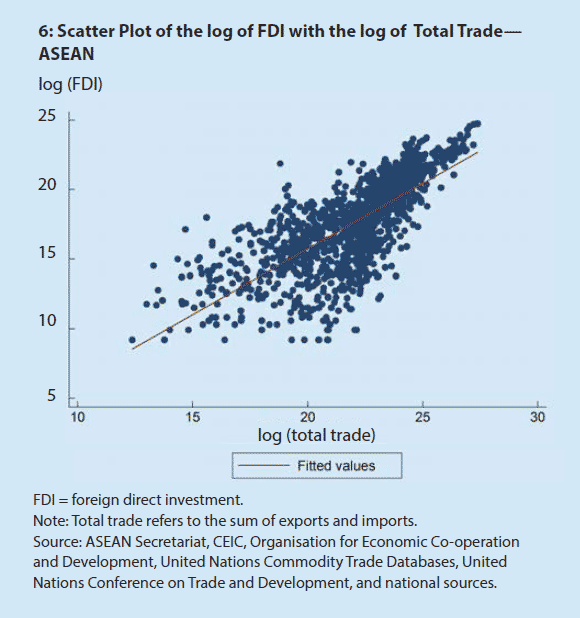
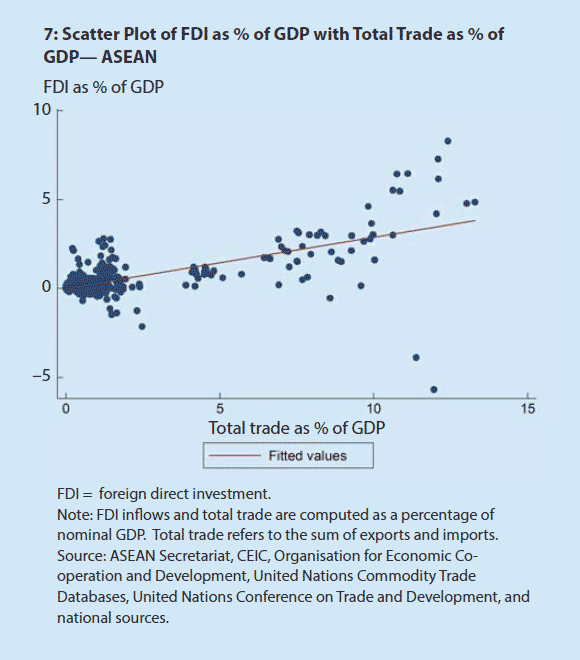
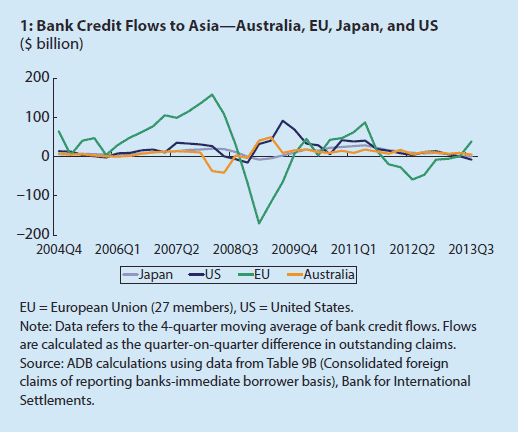
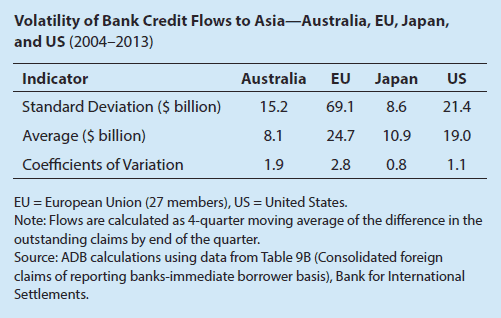
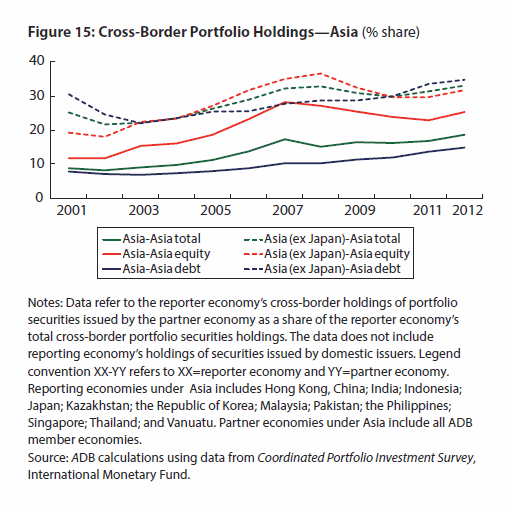
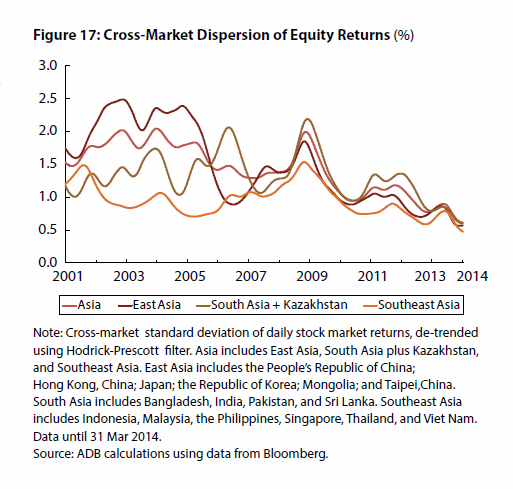
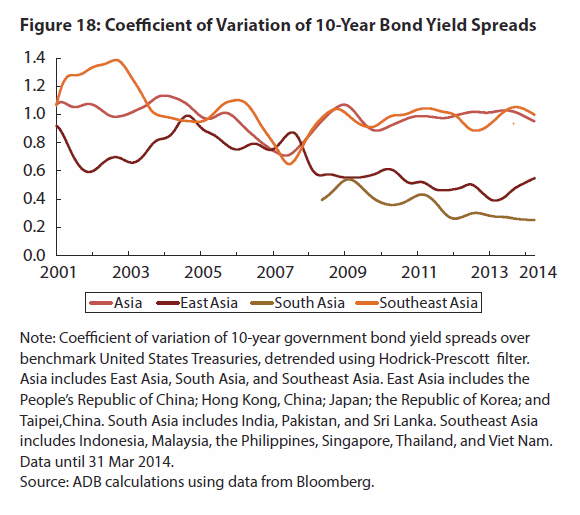
Boxes Chart | Data Intraregional FDI Inflows—Asia Chart | Data FDI Inflows—Asia, Developing economies, and the World Chart | Data FDI Inflows—Asia Chart | Data Exports and FDI Share—ASEAN Chart | Data Exports and FDI Share—PRC, Japan, and Republic of Korea Chart | Data Scatter Plot of the log of FDI with the log of Total Trade—ASEAN Chart | Data Scatter Plot of FDI as % of GDP with Total Trade as % of GDP— ASEAN Chart | Data Pooled Regression of FDI on Trade Chart | Data Bank Credit Flows to Asia—Australia, EU, Japan, and US Chart | Data Average Quarterly Bank Credit Flows to Asia— Australia, EU, Japan, and US Chart | Data Volatility of Bank Credit Flows to Asia—Australia, EU, Japan, and US Charts Chart | Data Figure 15: Cross-Border Portfolio Holdings—Asia Chart | Data Figure 16: Japanese and European1 Banks’ Foreign Claims in Asia Chart | Data Figure 17: Cross-Market Dispersion of Equity Returns Chart | Data Figure 18: Coefficient of Variation of 10-Year Bond Yield Spreads -
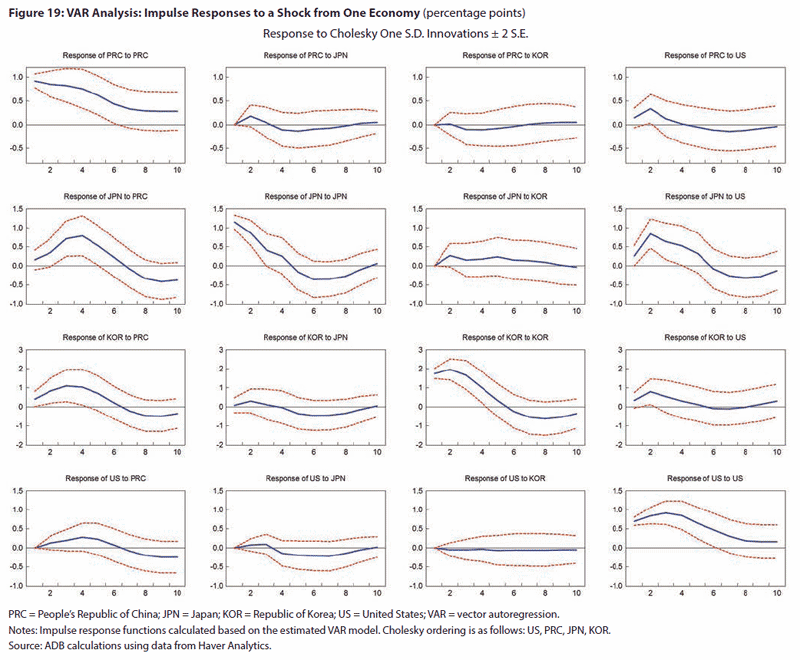
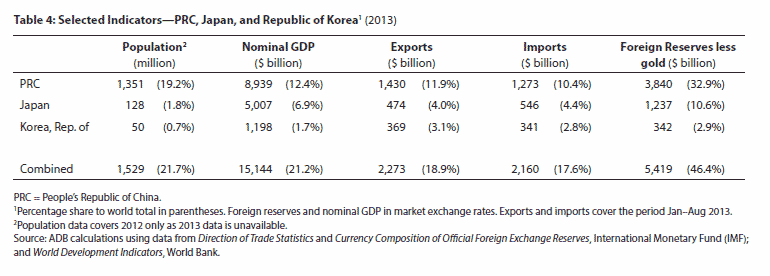
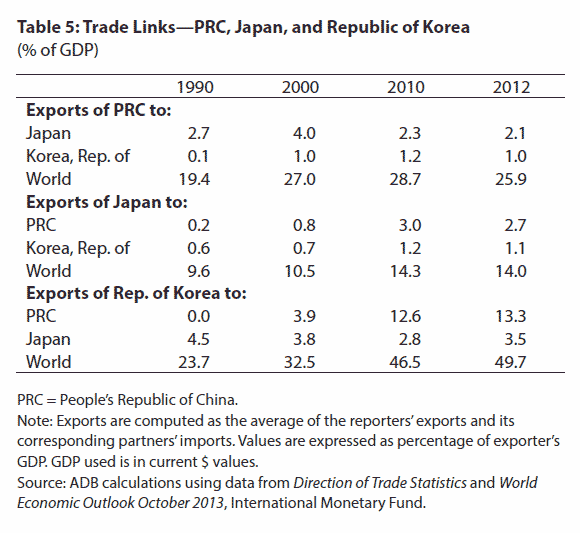
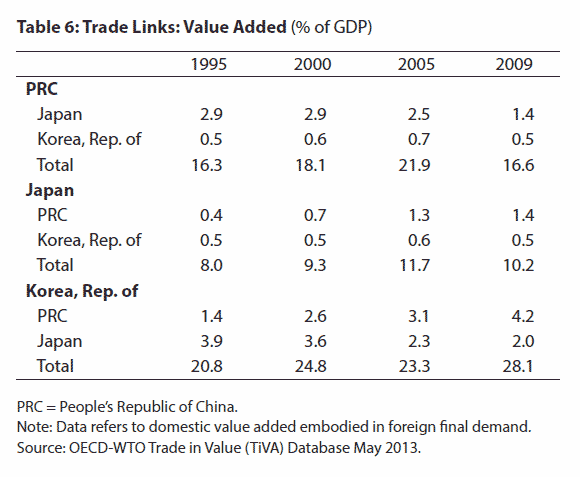
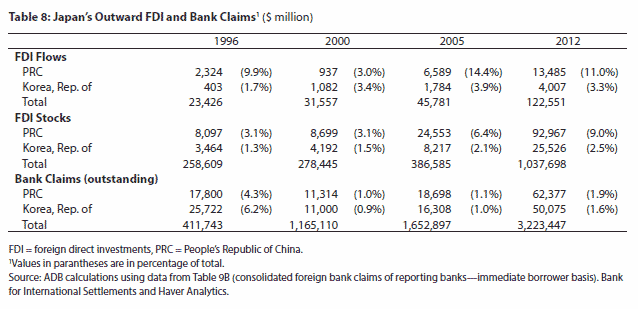
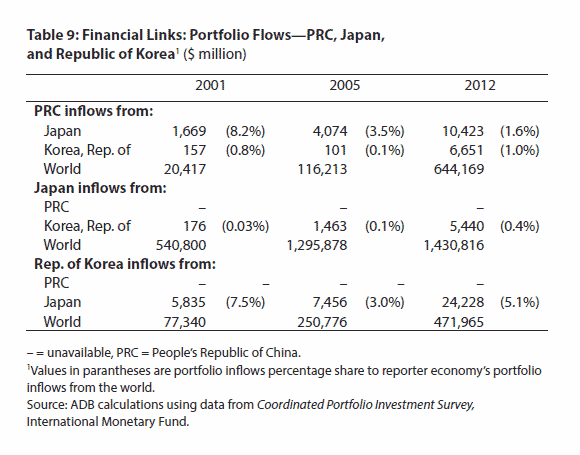
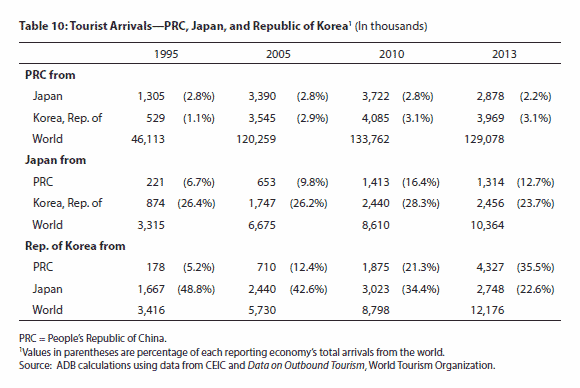
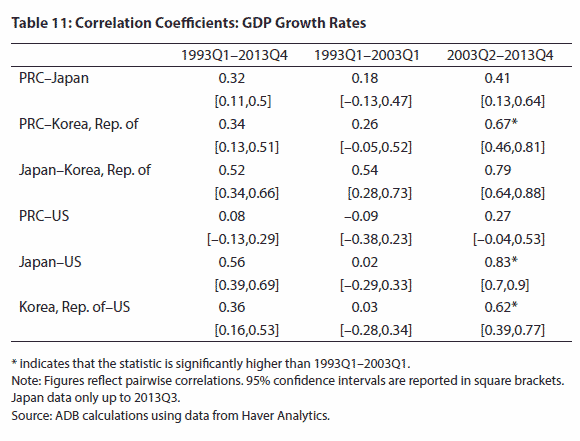
Macroeconomic Interdependence between the PRC, Japan, and the Republic of Korea
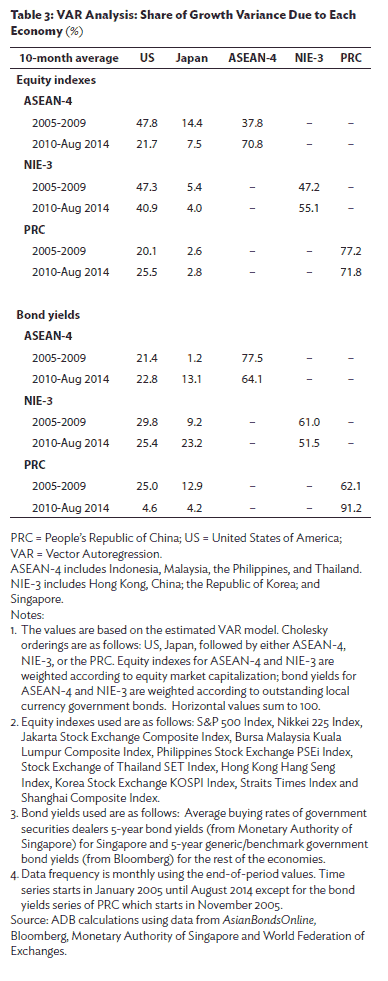
Charts Chart | Data Figure 19: VAR Analysis: Impulse Responses to a Shock from One Economy Tables Chart | Data Table 4: Selected Indicators—PRC, Japan, and Republic of Korea Chart | Data Table 5: Trade Links—PRC, Japan, and Republic of Korea Chart | Data Table 6: Trade Links: Value Added Chart | Data Table 7: Financial Links: Foreign Direct Investments—PRC, Japan, and Republic of Korea Chart | Data Table 8: Japan’s Outward FDI and Bank Claims1 Chart | Data Table 9: Financial Links: Portfolio Flows—PRC, Japan, and Republic of Korea Chart | Data Table 10: Tourist Arrivals—PRC, Japan, and Republic of Korea Chart | Data Table 11: Correlation Coefficients: GDP Growth Rates Chart | Data Table 12: VAR Analysis: Share of Growth Variance Due to Each Economy -
Updates on Labor Mobility and Remittances
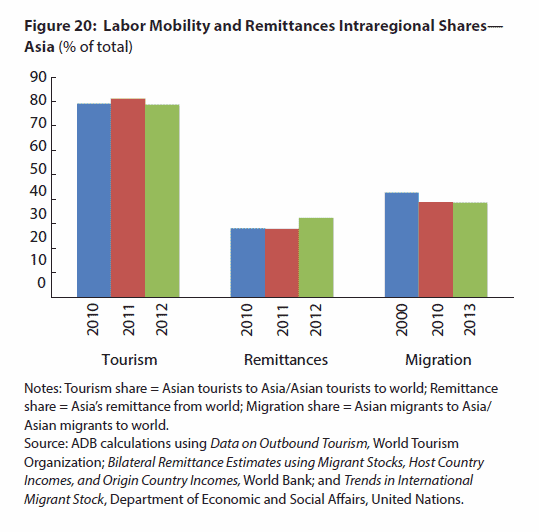
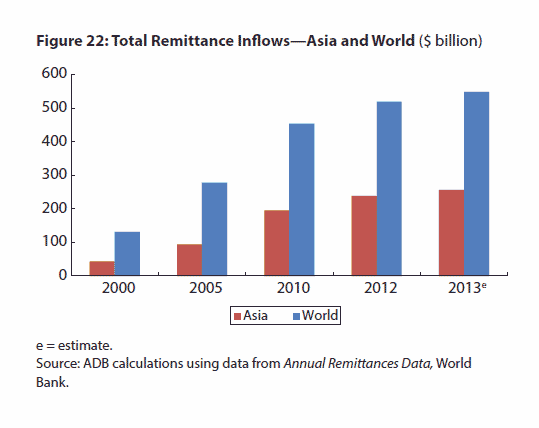
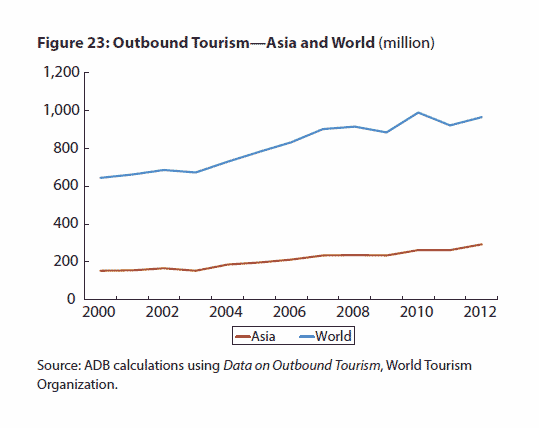
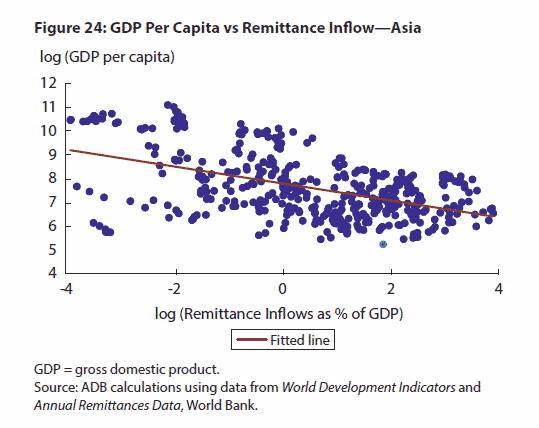
Charts Chart | Data Figure 20: Labor Mobility and Remittances Intraregional Shares— Asia Chart | Data Figure 21: Intraregional Migration Share—Asia Chart | Data Figure 22: Total Remittance Inflows—Asia and World Chart | Data Figure 23: Outbound Tourism—Asia and World Chart | Data Figure 24: GDP Per Capita vs Remittance Inflow—Asia Chart | Data Figure 25: Coefficient of Variation of Different Types of Capital Flows—Asia
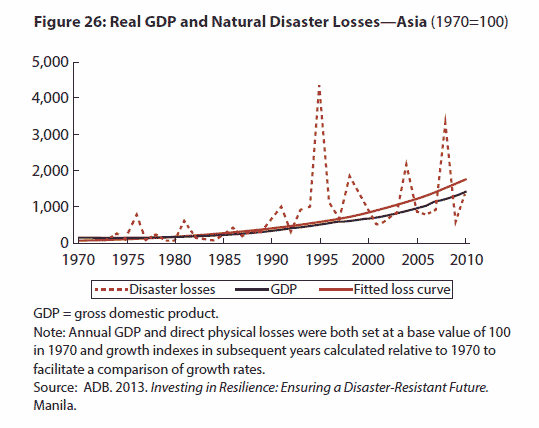
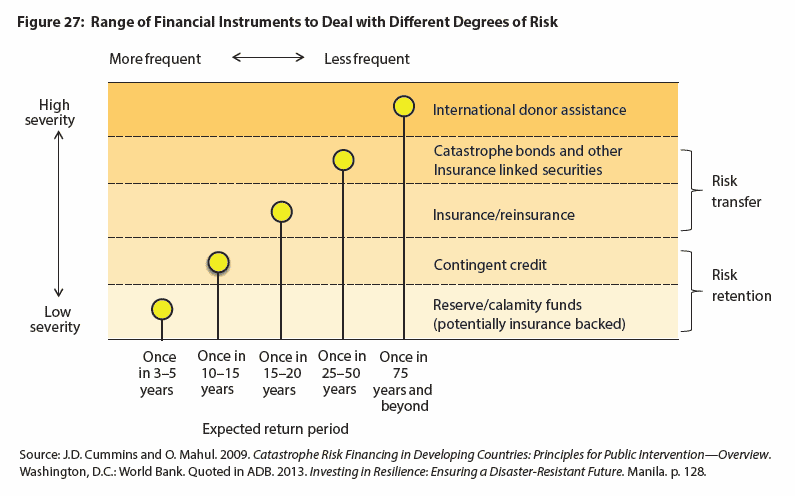
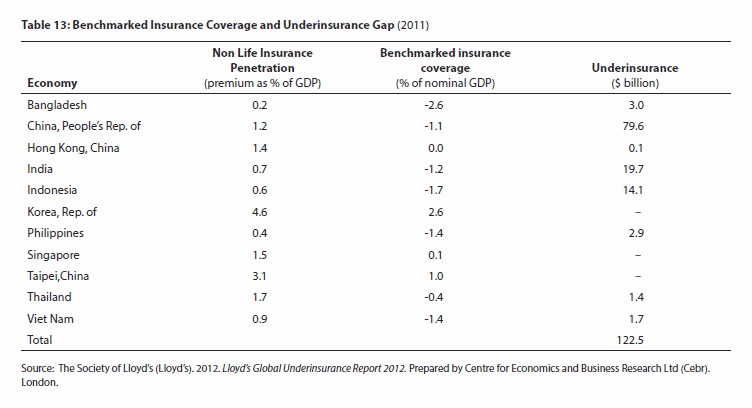
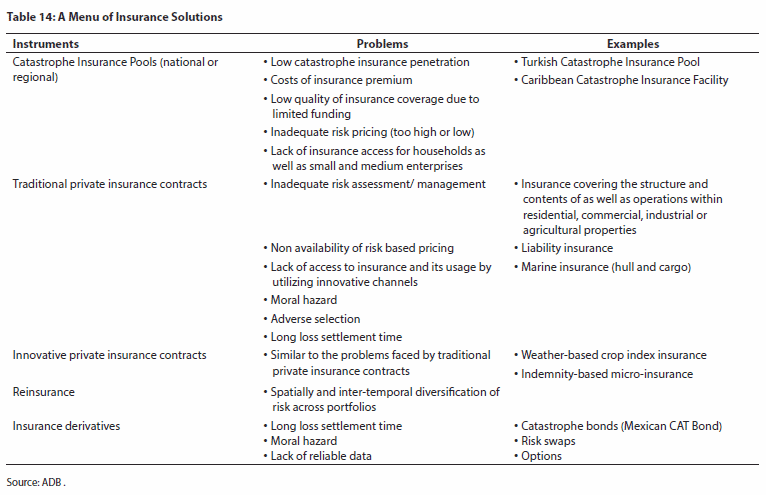
Theme Chapter: Insuring Against Asia’s Natural Catastrophes
Statistical Appendix: Regional Integration
-
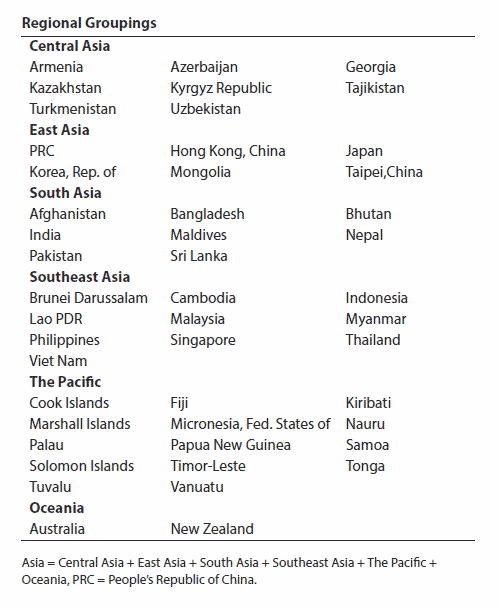
Regional Groupings
-
Table Descriptions
Tables Chart | Data Table A1: Trade Share—Asia Chart | Data Table A2. Time to Export or Import—Asia Chart | Data Table A3: Logistics Performance Index (LPI) Scores—Asia Chart | Data Table A4: Cross-Border Equity Holdings Chart | Data Table A5: Cross-Border Bond Holdings Chart | Data Table A6: FDI Inflow Share—Asia Chart | Data Table A7: Remittance Inflows Share—Asia Chart | Data Table A8: Outbound Migration Share—Asia Chart | Data Table A9: Outbound Tourism Share—Asia
Complete Report
October 2013
Cover and Highlights
Part I: Regional Economic Update
-
External economic environment
-
Regional economic outlook
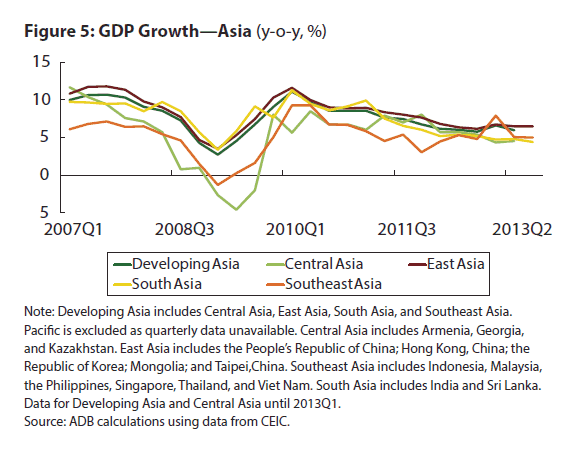
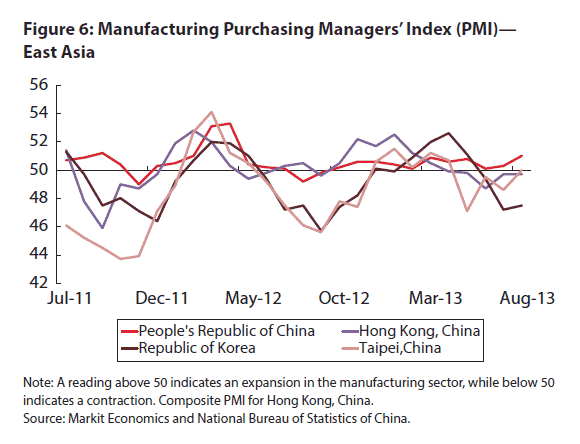
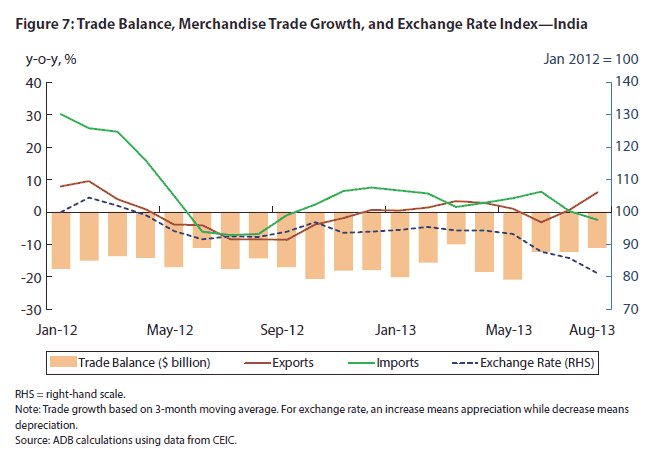
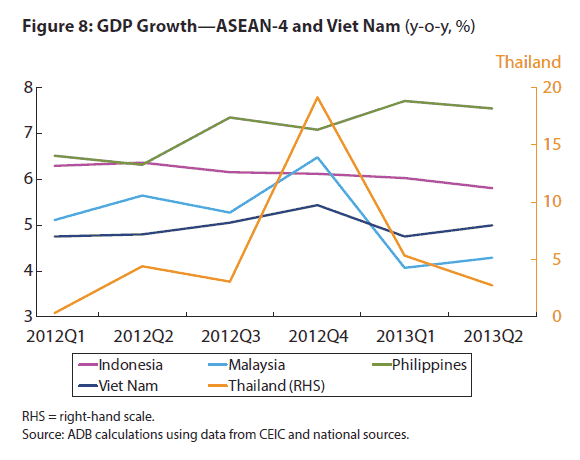
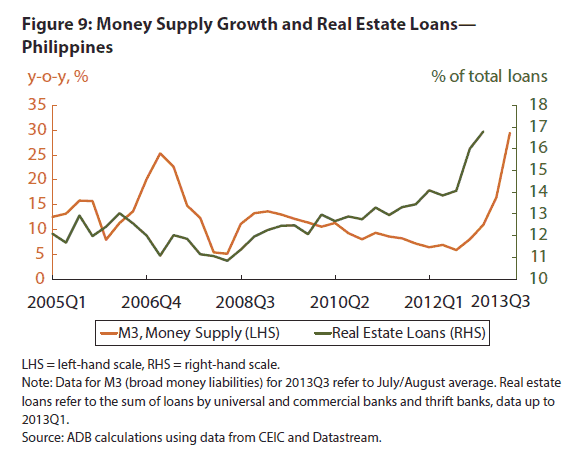
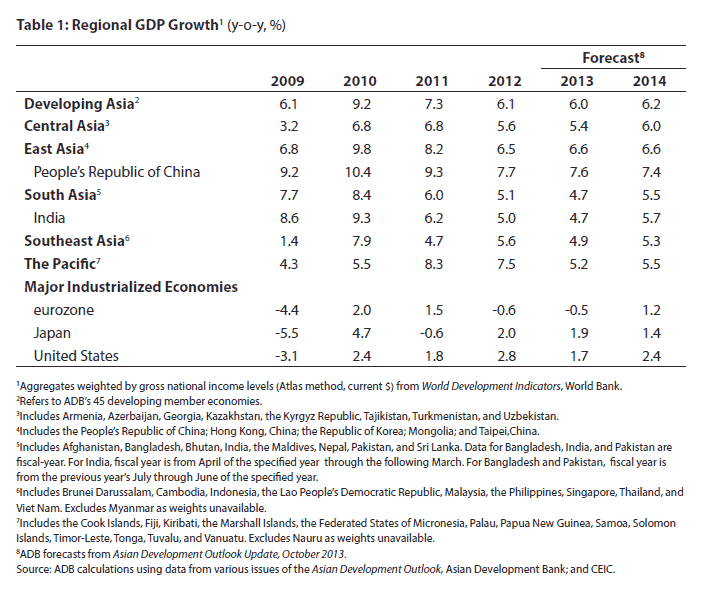
Charts Chart | Data Figure 5: GDP Growth—Asia Chart | Data Figure 6: Manufacturing Purchasing Managers’ Index (PMI)—East Asia Chart | Data Figure 7: Trade Balance, Merchandise Trade Growth, and Exchange Rate Index—India Chart | Data Figure 8: GDP Growth—ASEAN-4 and Viet Nam Chart | Data Figure 9: Money Supply Growth and Real Estate Loans—Philippines Tables Chart | Data Table 1: Regional GDP Growth
Part II: Progress in Regional Cooperation and Integration
-
Progress and issues
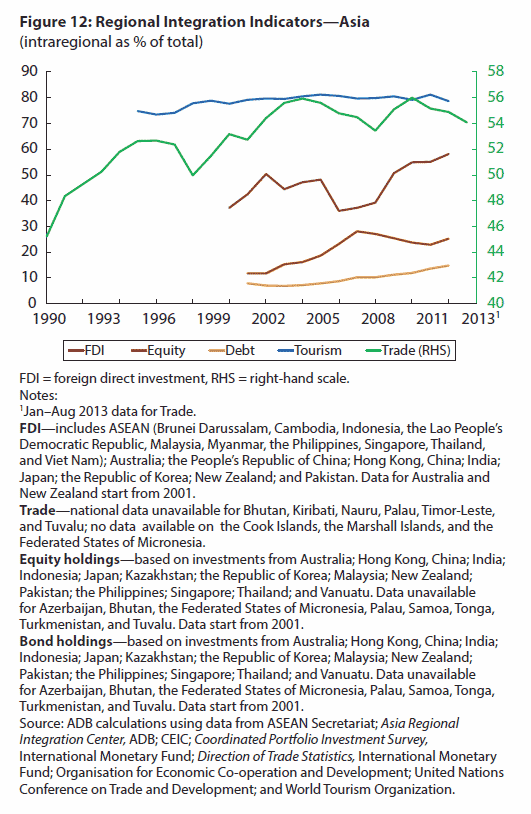
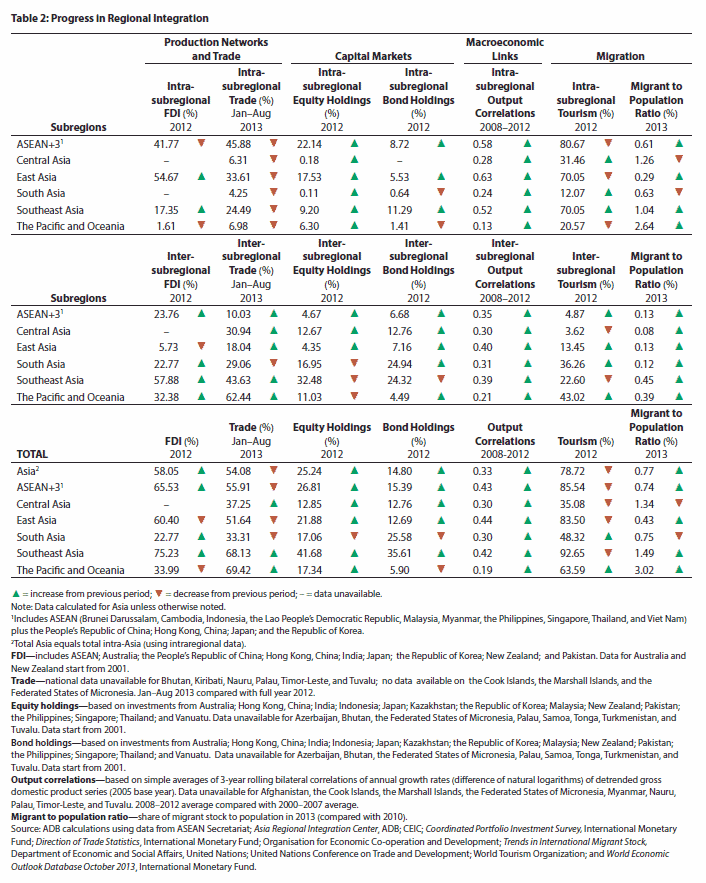
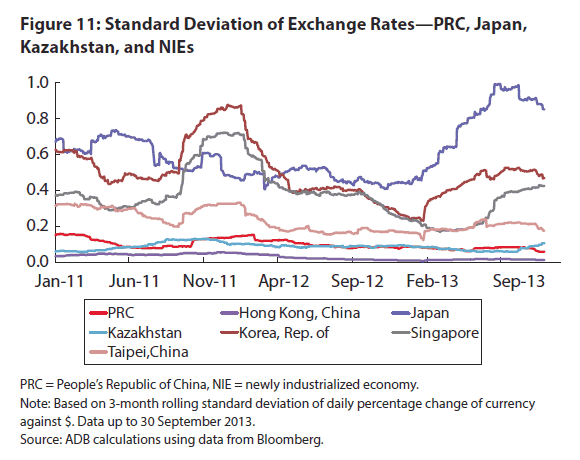
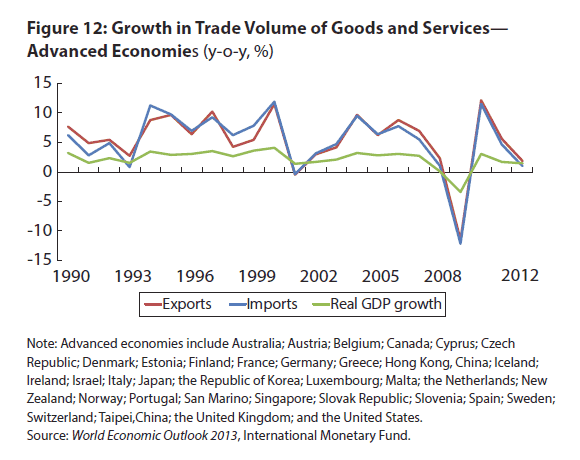
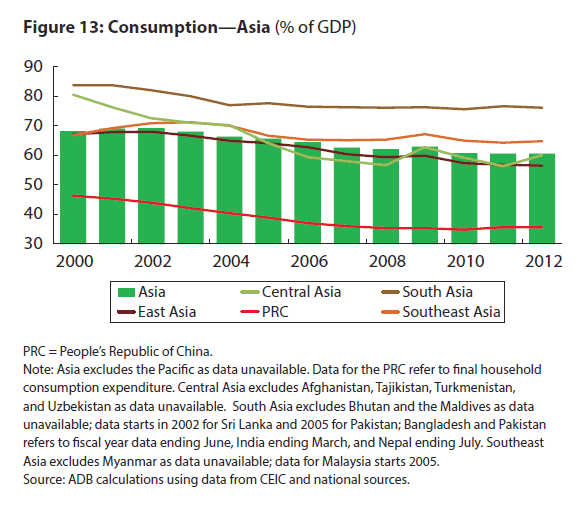
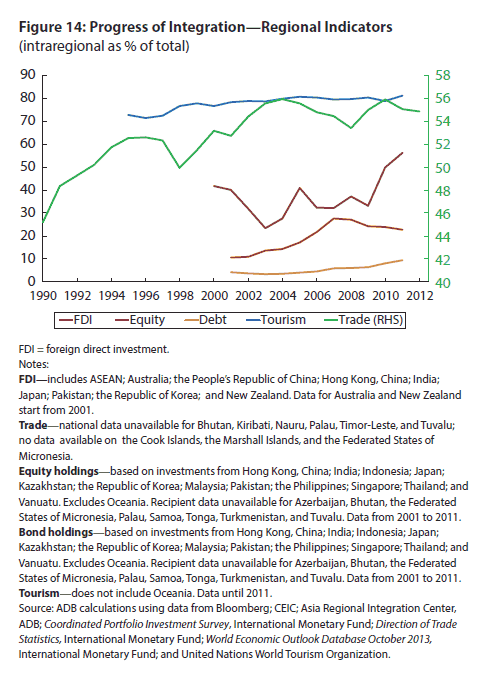
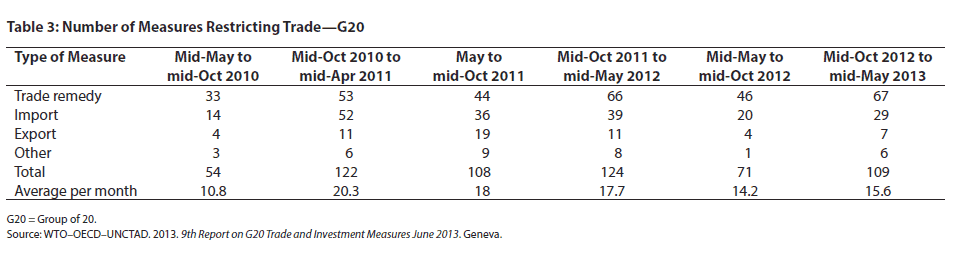
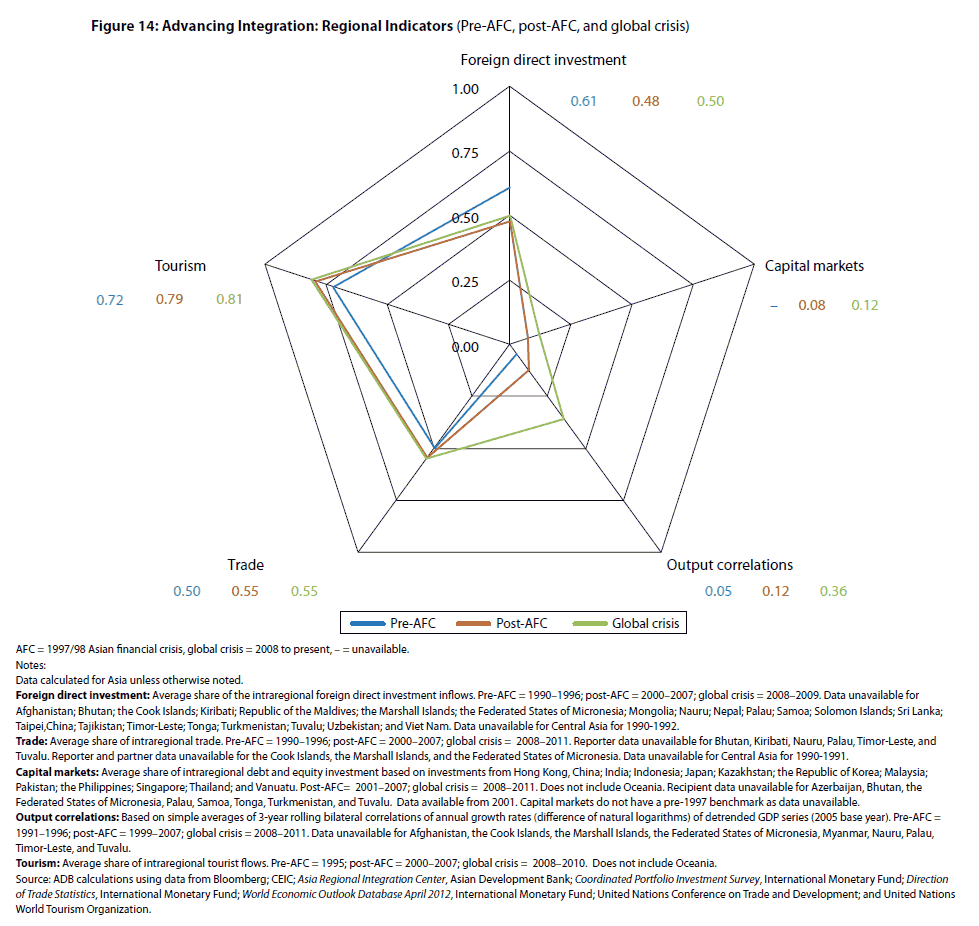
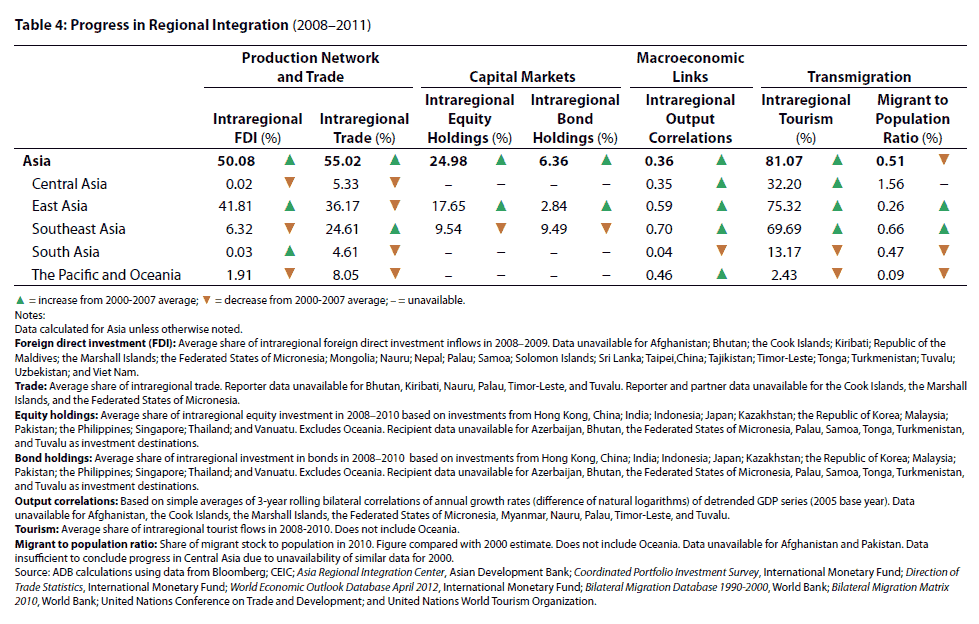
Charts Chart | Data Figure 10: Standard Deviation of Exchange Rates—South and Southeast Asia Chart | Data Figure 11: Standard Deviation of Exchange Rates—PRC, Japan, Kazakhstan, and NIEs Chart | Data Figure 12: Growth in Trade Volume of Goods and Services—Advanced Economies Chart | Data Figure 13: Consumption—Asia Chart | Data Figure 14: Progress of Integration—Regional Indicators Tables Chart | Data Table 2: Progress in Regional Integration Chart | Data Table 3: Number of Measures Restricting Trade—G20 -
Intraregional trade in services
-
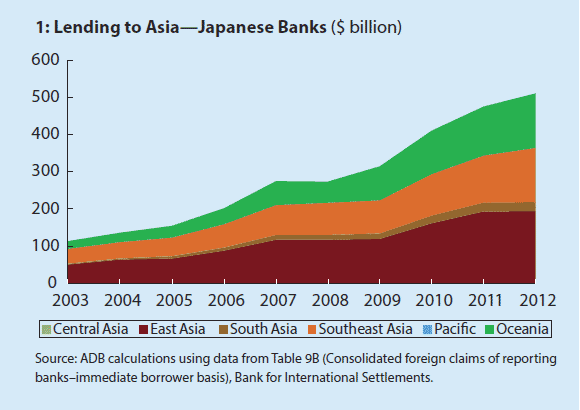
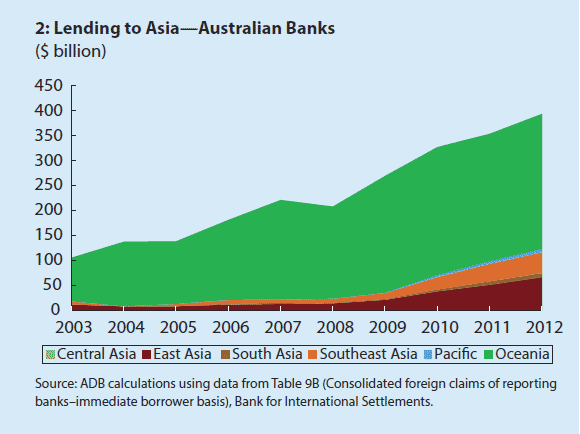
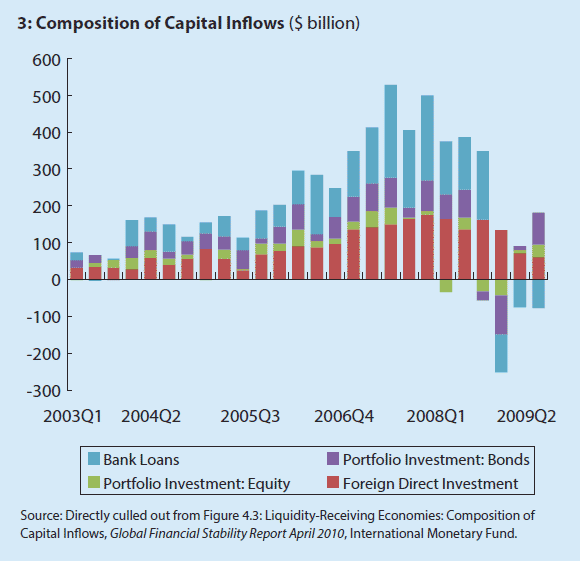
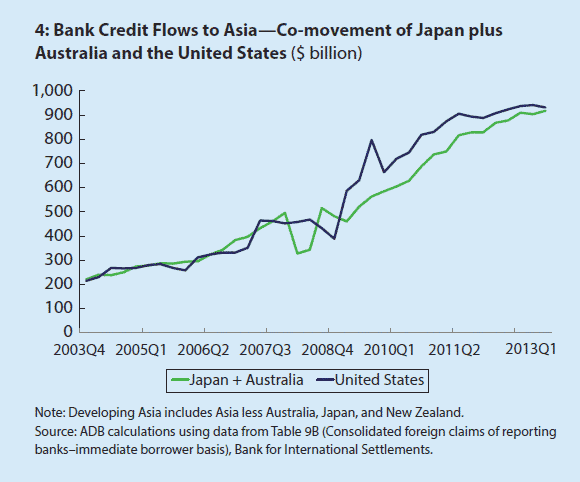
Updates on financial integration
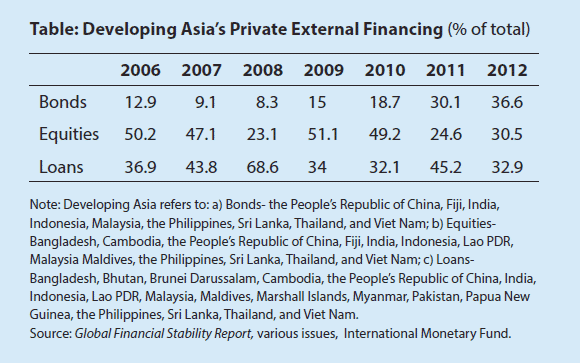
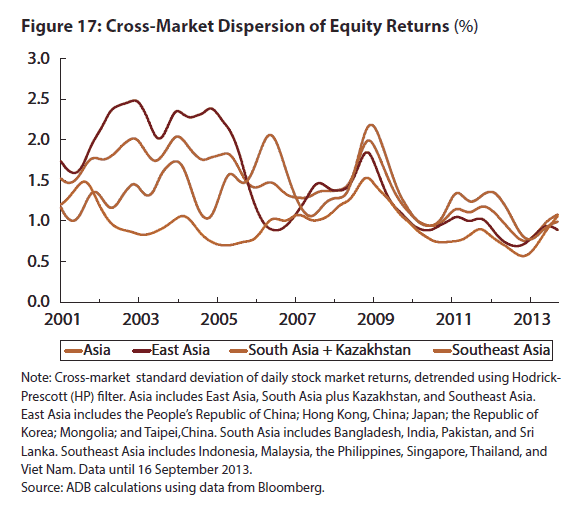
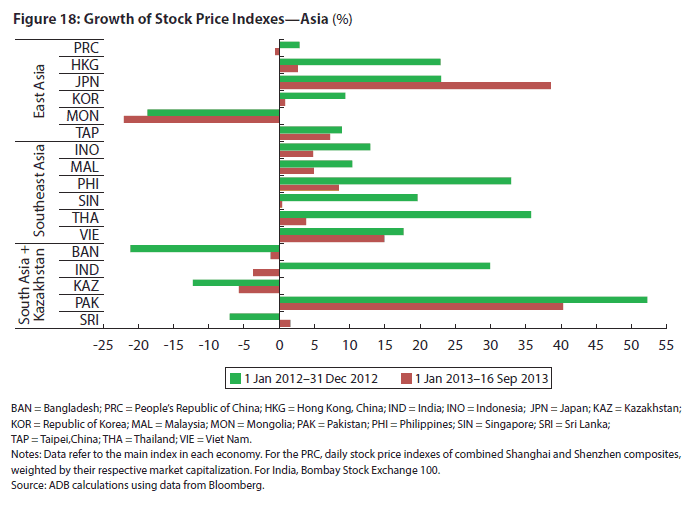
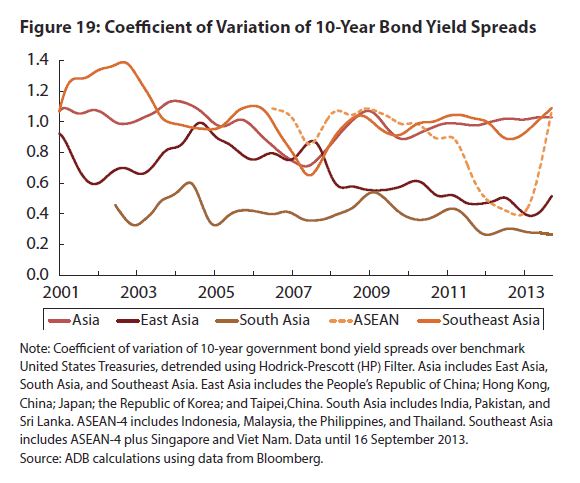
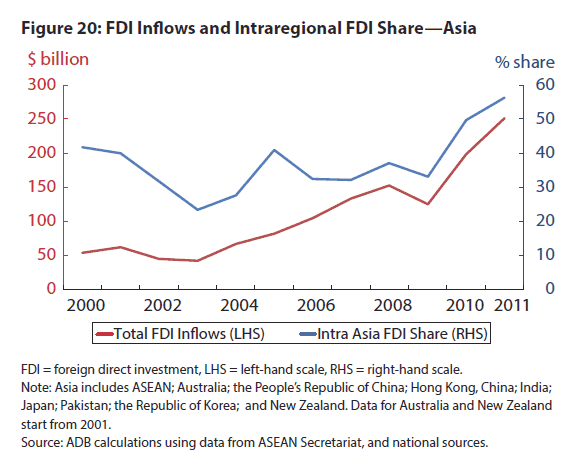
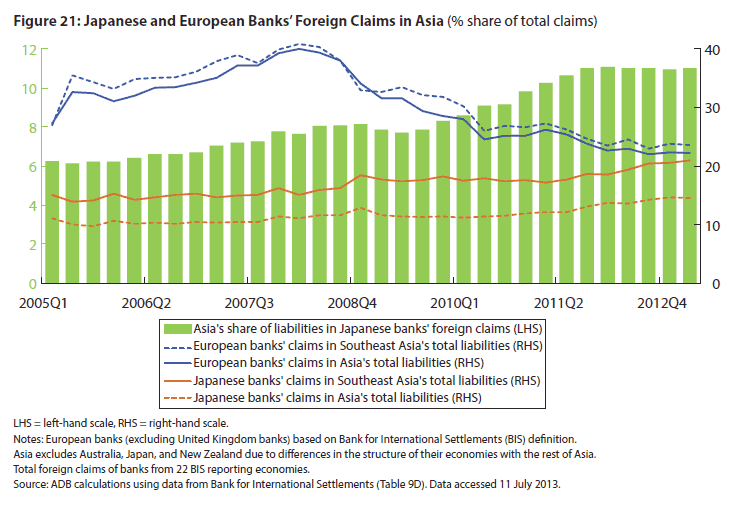
Boxes Chart | Data Box 2 - Table01: Developing Asia’s Private External Financing Chart | Data Box 2 - Fig 01: Lending to Asia—Japanese Banks Chart | Data Box 2 - Fig 02: Lending to Asia—Australian Banks Chart | Data Box 2 - Fig 03: Composition of Capital Inflows Chart | Data Box 2 - Fig 04: Bank Credit Flows to Asia—Co-movement of Japan plus Australia and the United States Charts Chart | Data Figure 17: Cross-Market Dispersion of Equity Returns Chart | Data Figure 18: Growth of Stock Price Indexes—Asia Chart | Data Figure 19: Coefficient of Variation of 10-Year Bond Yield Spreads Chart | Data Figure 20: FDI Inflows and Intraregional FDI Share—Asia Chart | Data Figure 21: Japanese and European Banks’ Foreign Claims in Asia -
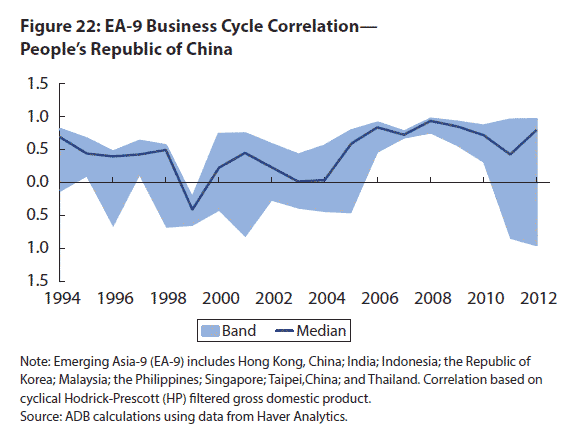
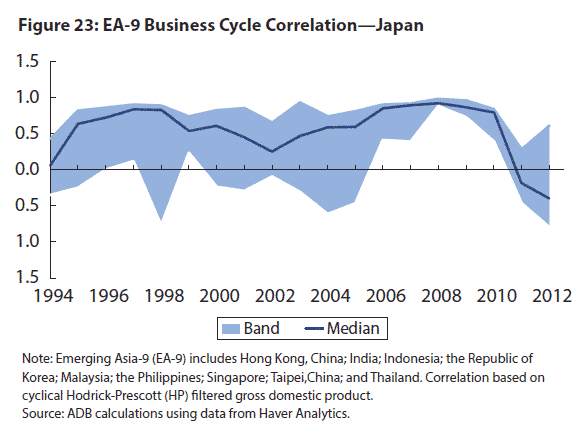
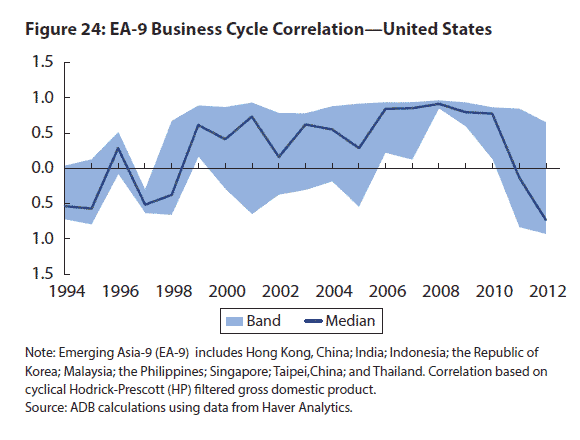
Business cycle synchronization
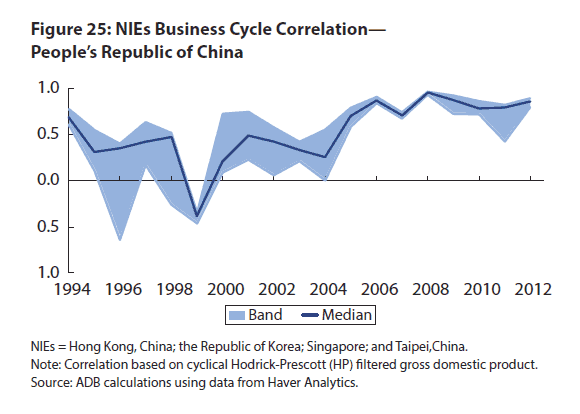
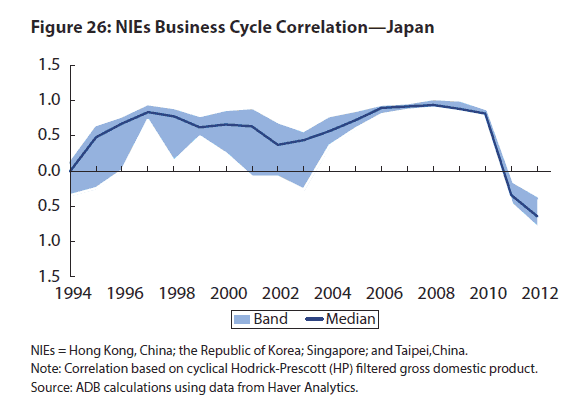
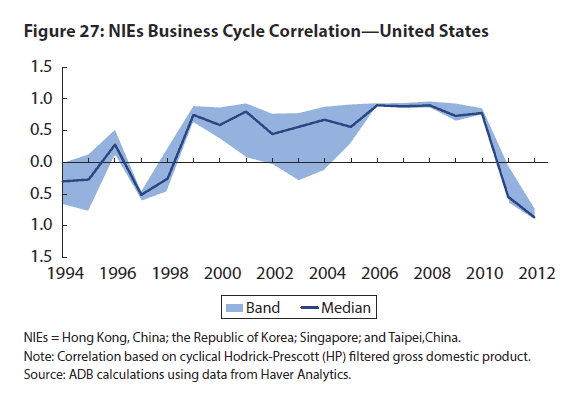
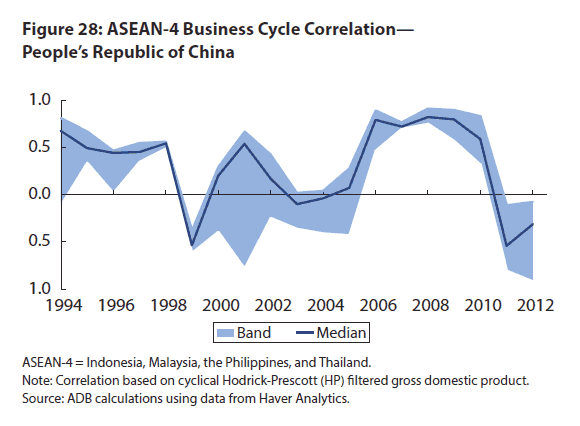
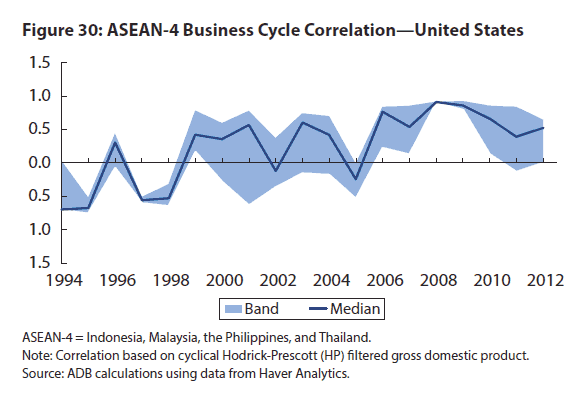
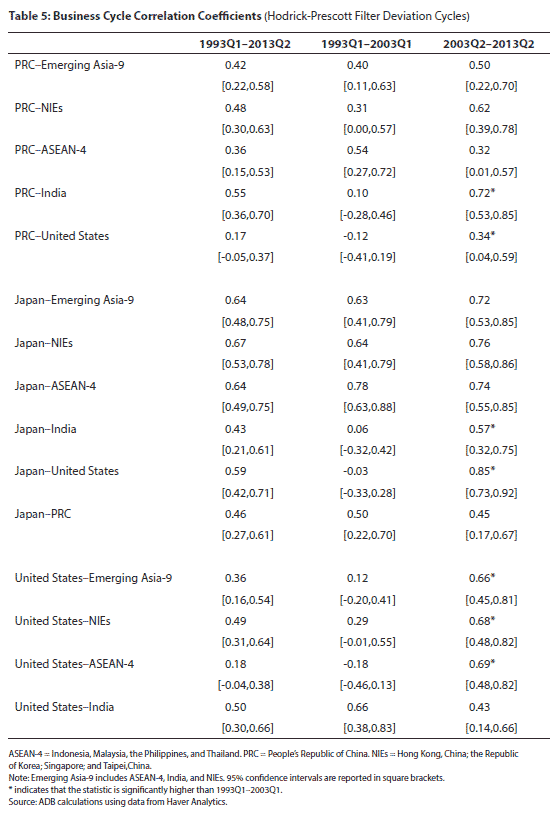
Charts Chart | Data Figure 22: EA-9 Business Cycle Correlation—People’s Republic of China Chart | Data Figure 23: EA-9 Business Cycle Correlation—Japan Chart | Data Figure 24: EA-9 Business Cycle Correlation—United States Chart | Data Figure 25: NIEs Business Cycle Correlation—People’s Republic of China Chart | Data Figure 26: NIEs Business Cycle Correlation—Japan Chart | Data Figure 27: NIEs Business Cycle Correlation—United States Chart | Data Figure 28: ASEAN-4 Business Cycle Correlation—People’s Republic of China Chart | Data Figure 29: ASEAN-4 Business Cycle Correlation—Japan Chart | Data Figure 30: ASEAN-4 Business Cycle Correlation—United States Tables Chart | Data Table 5: Business Cycle Correlation Coefficients -
Updates on labor mobility and remittances
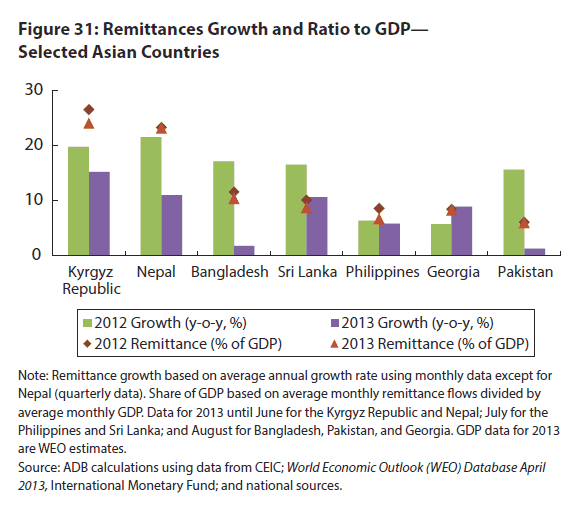
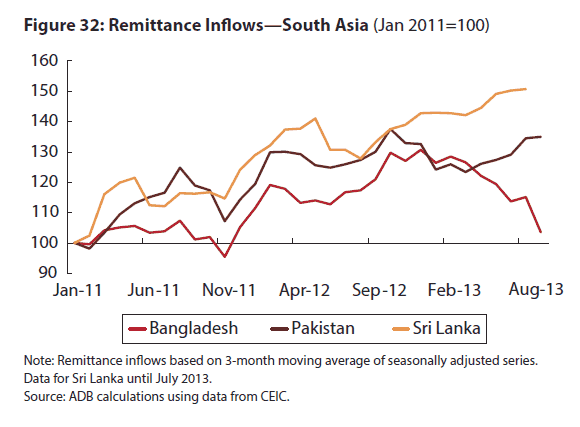
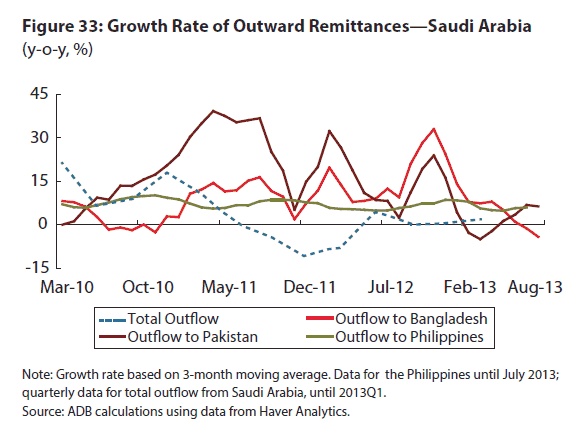
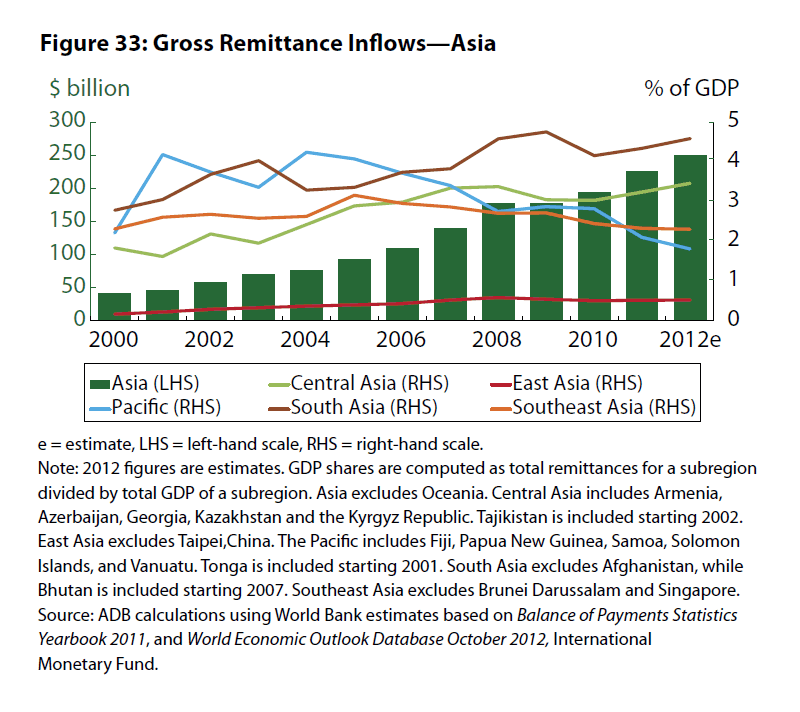
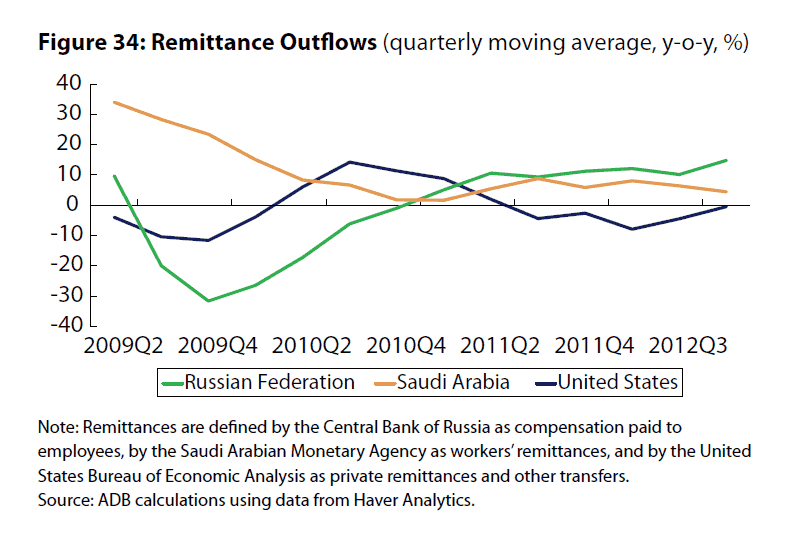
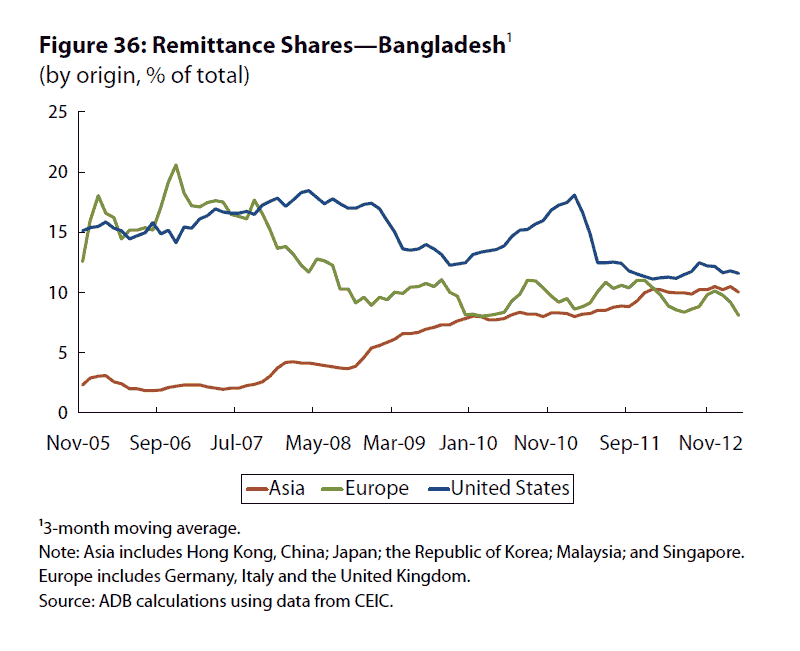
Charts Chart | Data Figure 31: Remittances Growth and Ratio to GDP—Selected Asian Countries Chart | Data Figure 32: Remittance Inflows—South Asia Chart | Data Figure 33: Growth Rate of Outward Remittances—Saudi Arabia Chart | Data Figure 34: Share of Top Five Sources of Remittances—Bangladesh, Pakistan, and Philippines
Theme Chapter I:
Toward an ASEAN Economic Community—and Beyond
Theme Chapter II:
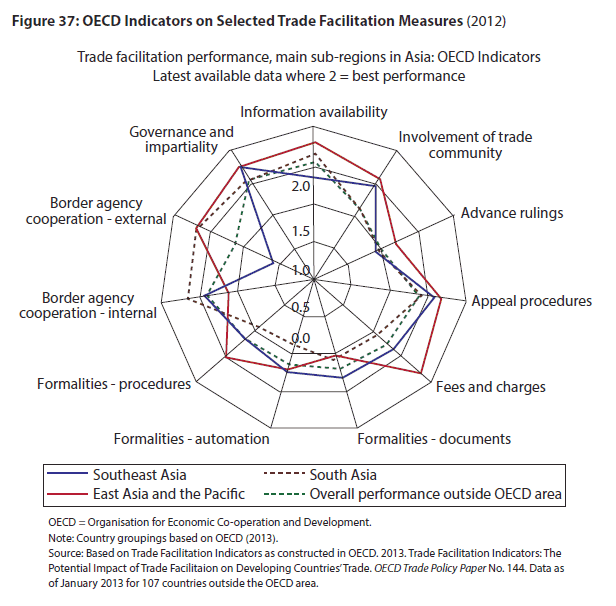
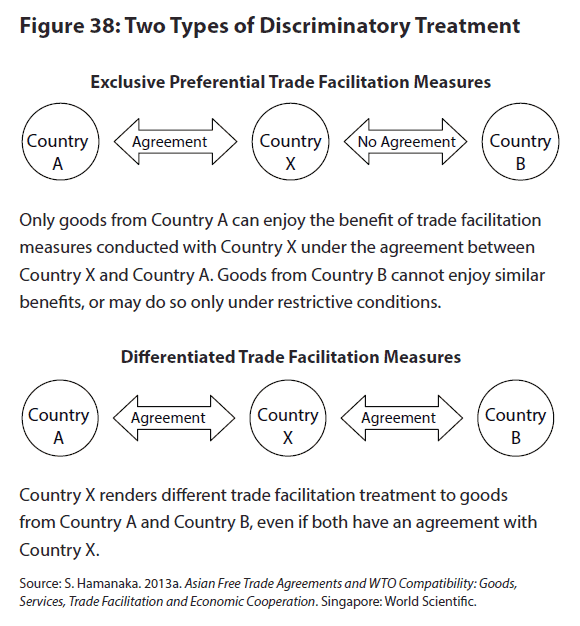
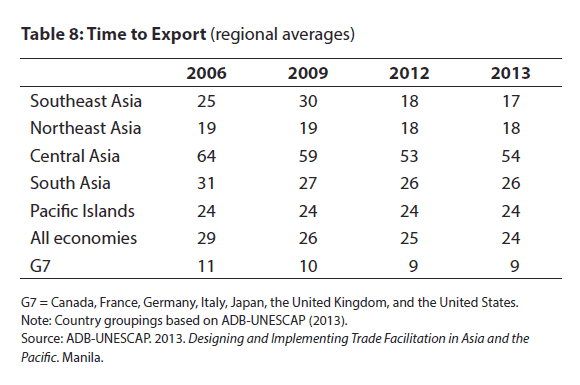
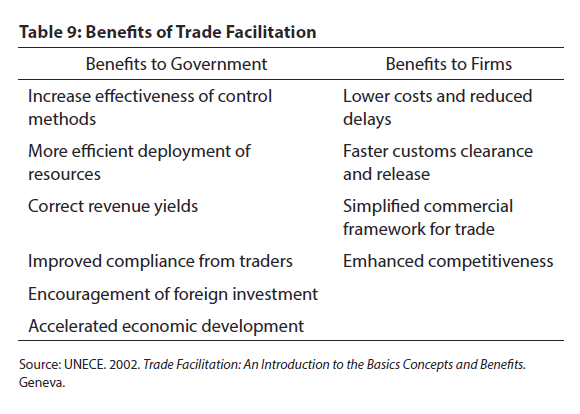
World Trade Facilitation Negotiations—Asian Perspectives
Complete Report
March 2013
Cover and Highlights
Part I: Regional Economic Update
| Charts | |
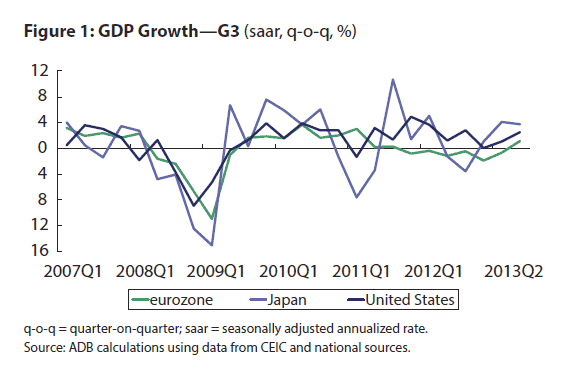
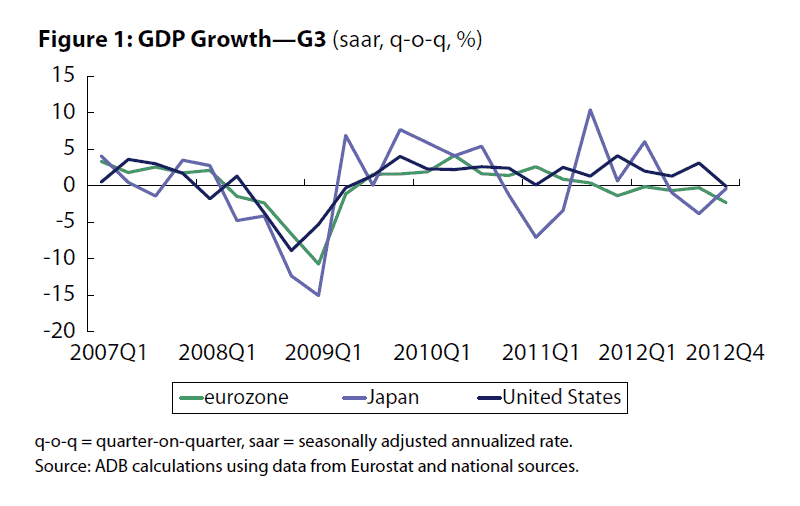
| Chart | Data | Figure 1: GDP Growth—G3 |
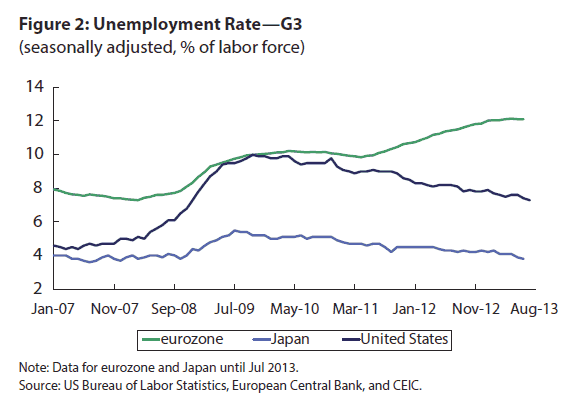
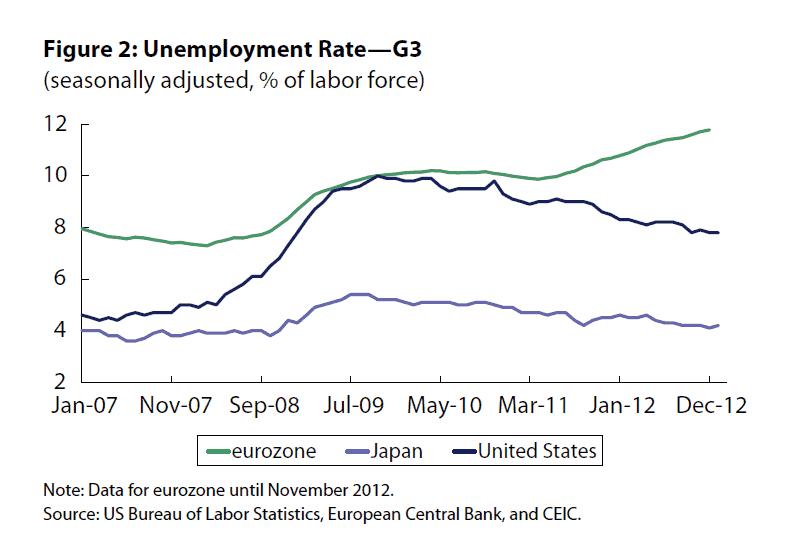
| Chart | Data | Figure 2: Unemployment Rate—G3 |
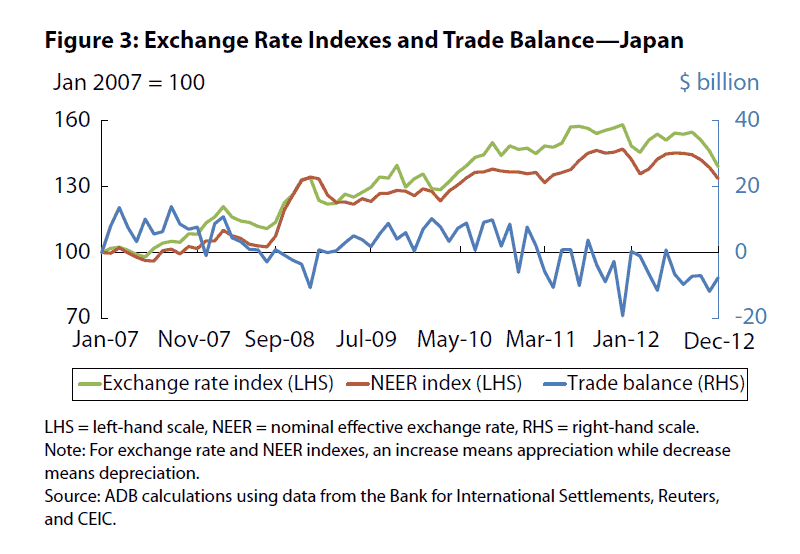
| Chart | Data | Figure 3: Exchange Rate Indexes and Trade Balance—Japan |
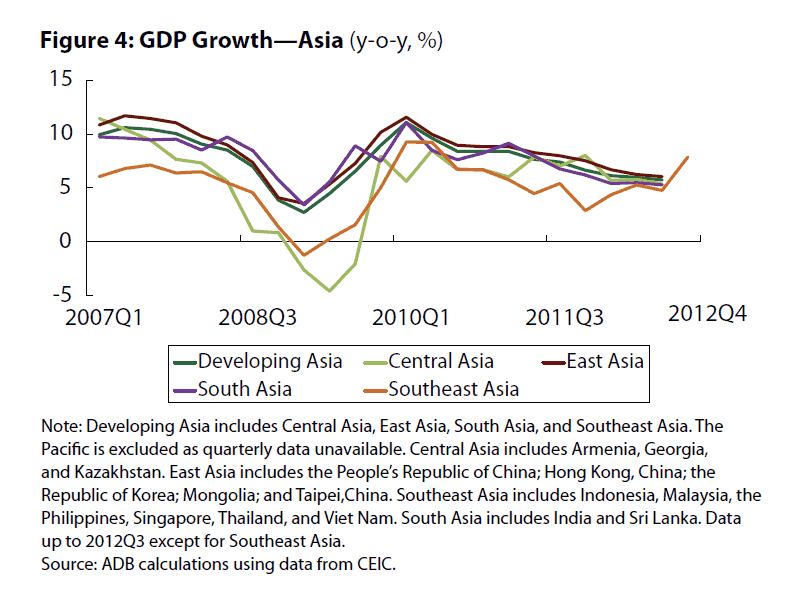
| Chart | Data | Figure 4: GDP Growth—Asia |
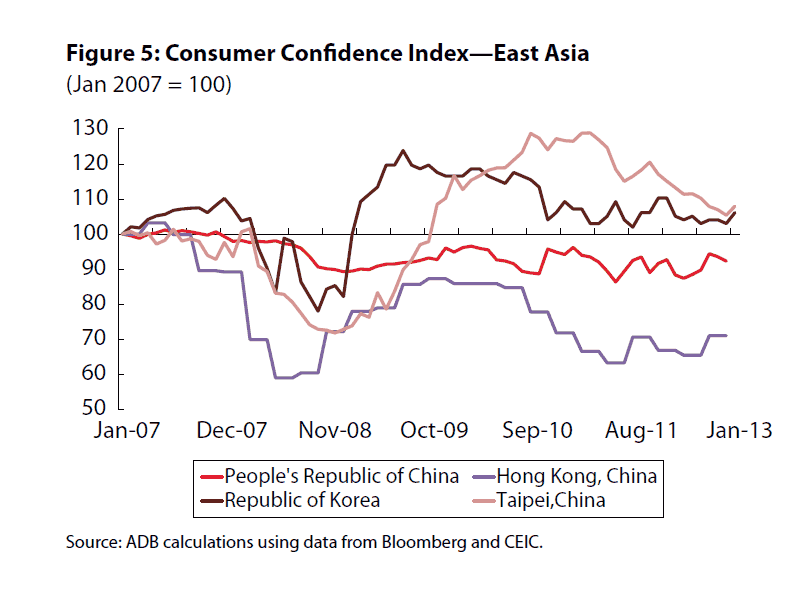
| Chart | Data | Figure 5: Consumer Confidence Index—East Asia |
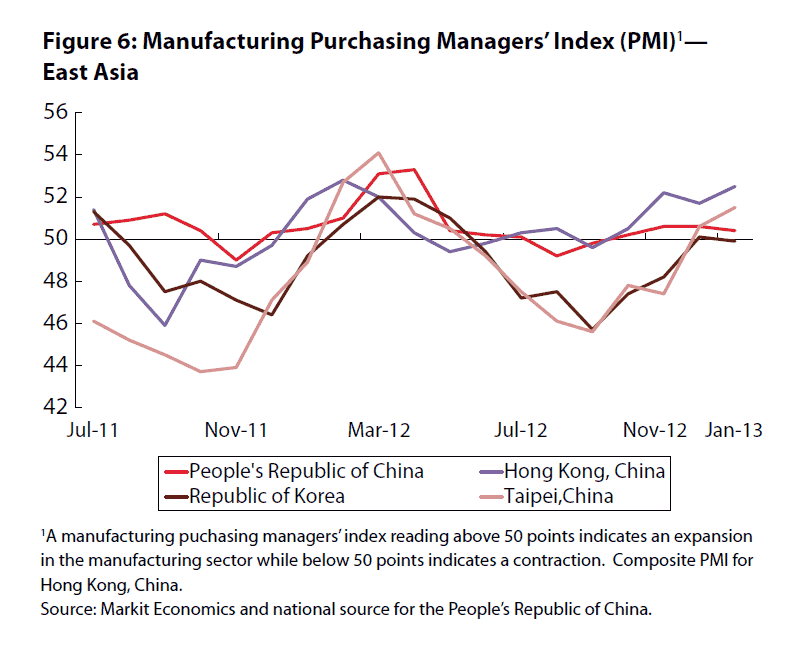
| Chart | Data | Figure 6: Manufacturing Purchasing Managers’ Index—East Asia |
| Chart | Data | Figure 7: Growth of Leading Indicators for Domestic Demand—Indi |
| Chart | Data | Figure 8: Headline Inflation—South Asia |
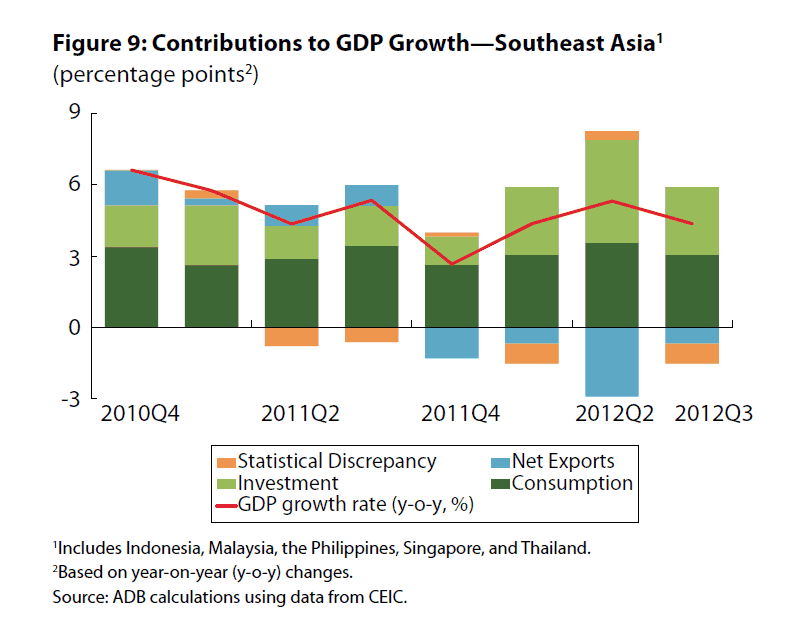
| Chart | Data | Figure 9: Contributions to GDP Growth—Southeast Asia |
| Chart | Data | Figure 10: Consumer Confidence Index—Southeast Asia | Tables |
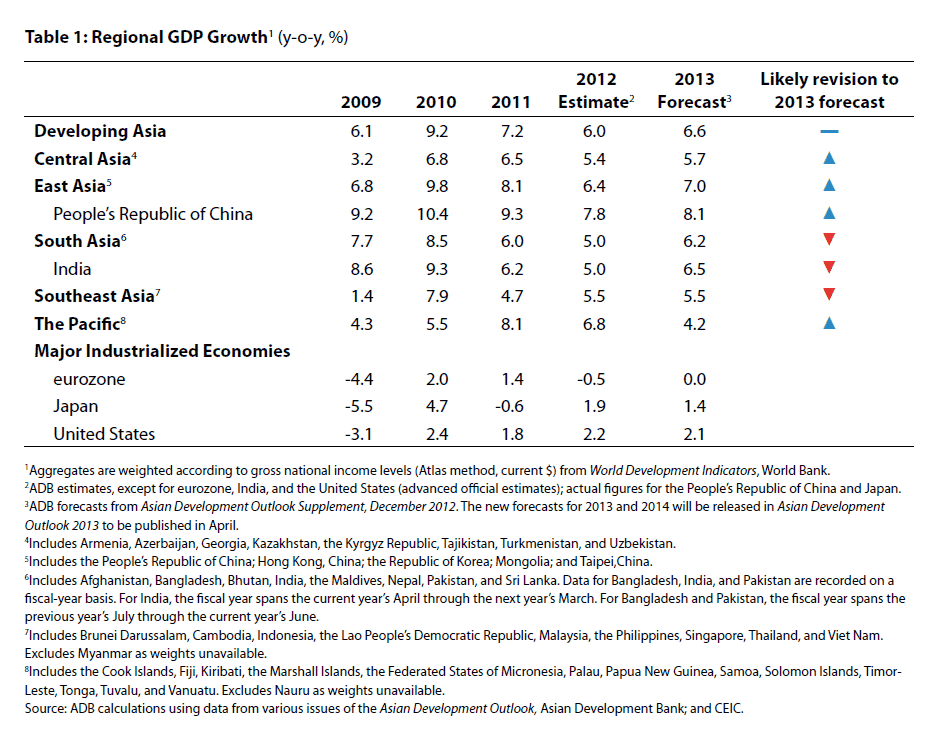
| Chart | Data | Table 1: Regional GDP Growth |
Part II: Progress in Regional Cooperation and Integration
-
Introduction
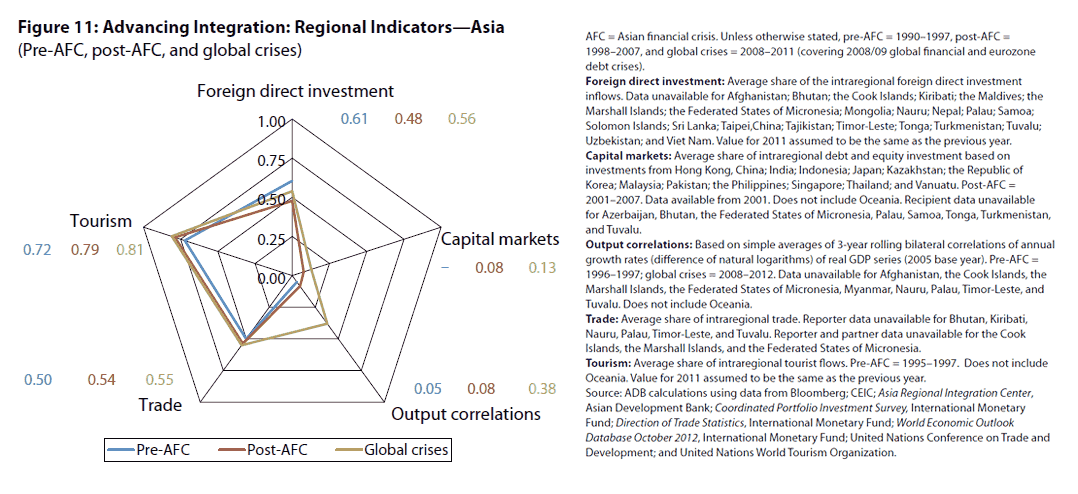
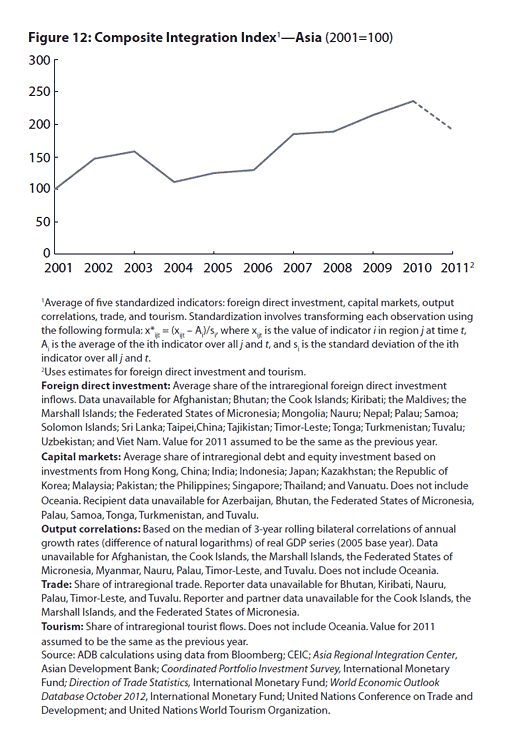
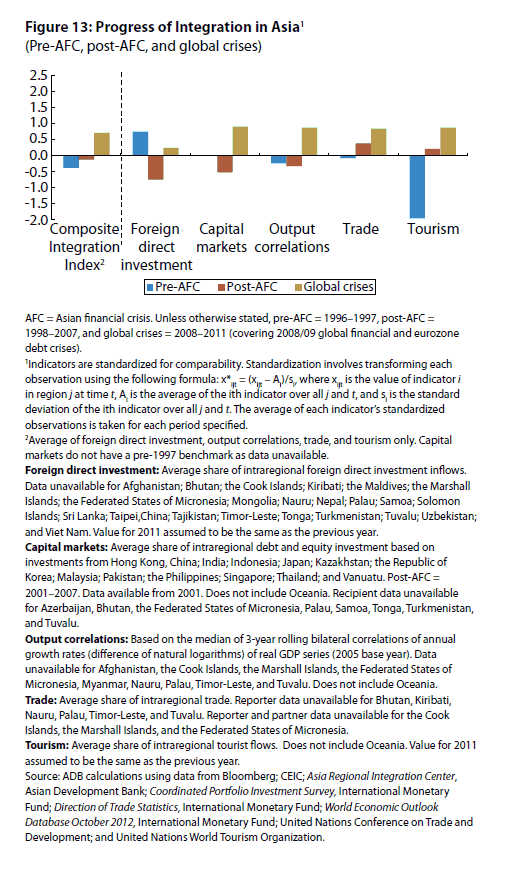
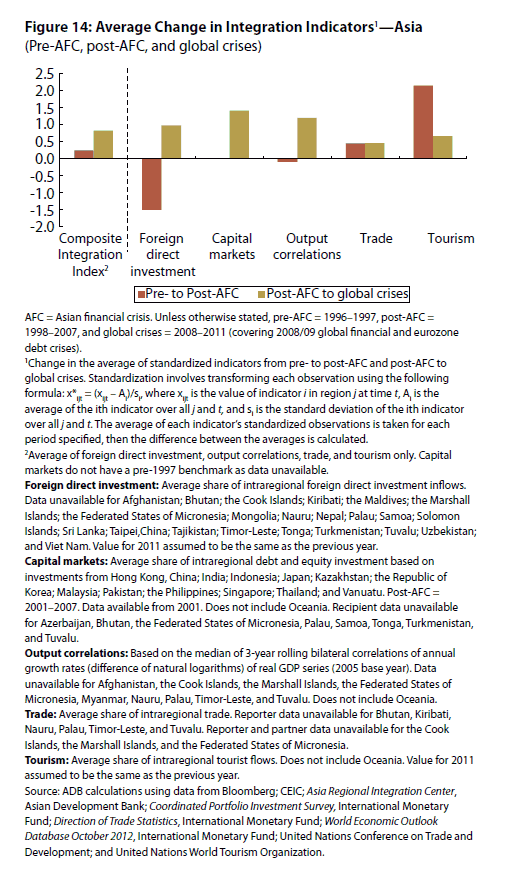
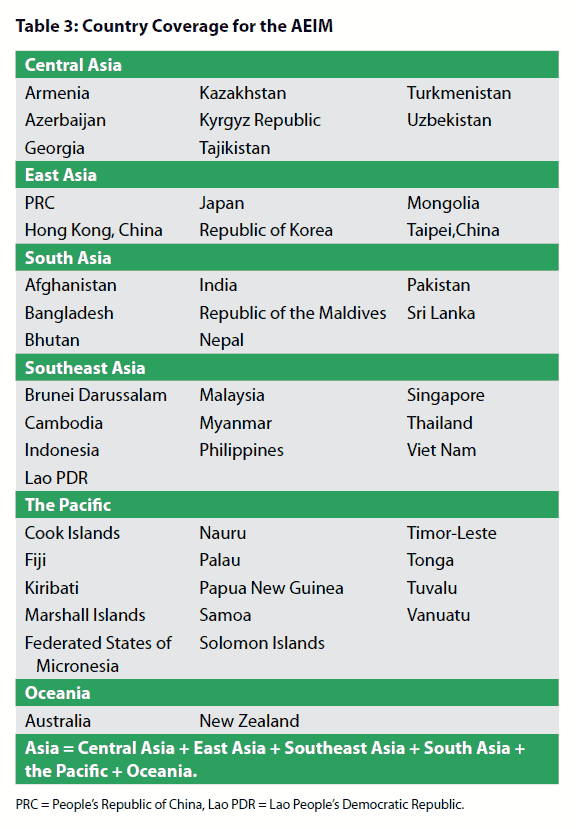
Charts Chart | Data Figure 11: Advancing Integration: Regional Indicators—Asia Chart | Data Figure 12: Composite Integration Index—Asia Chart | Data Figure 13: Progress of Integration in Asia Chart | Data Figure 14: Average Change in Integration Indicators—Asia Tables Chart | Data Table 2: Country Coverage -
Trade Integration
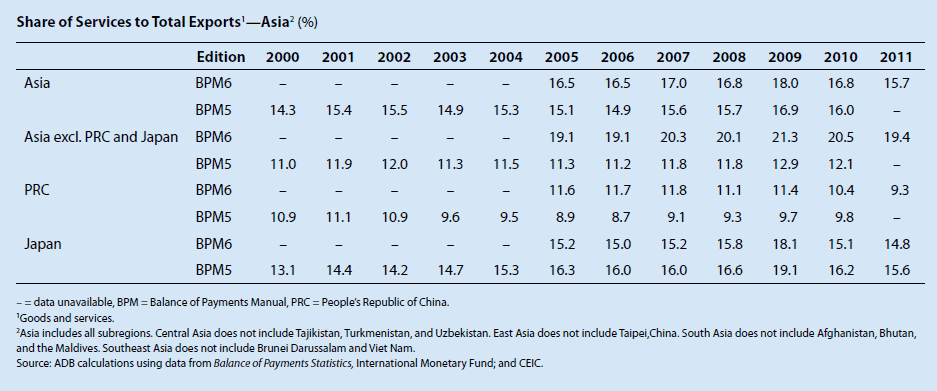
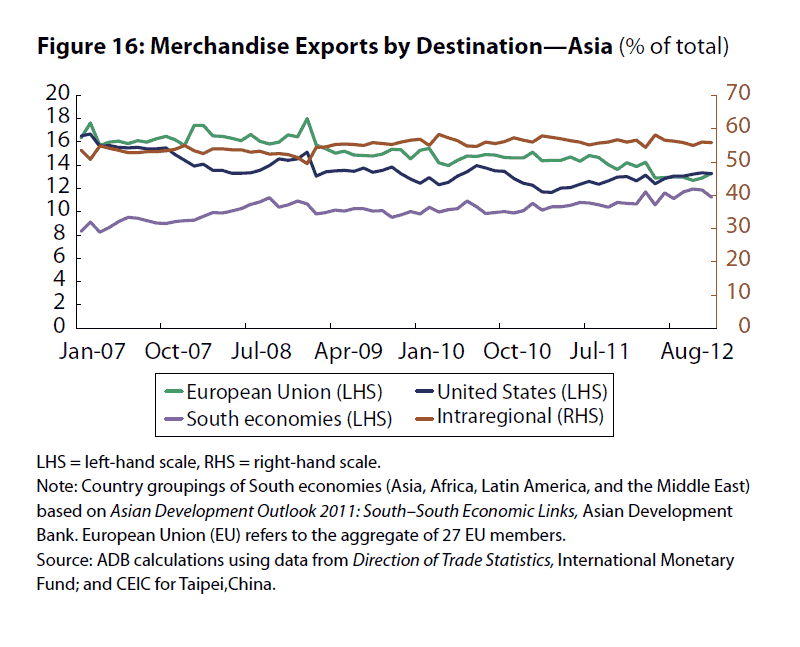
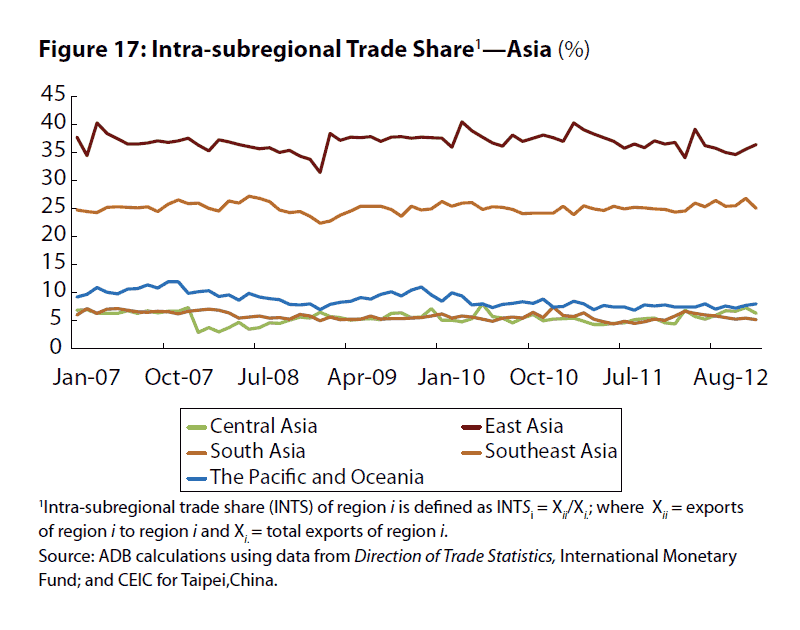
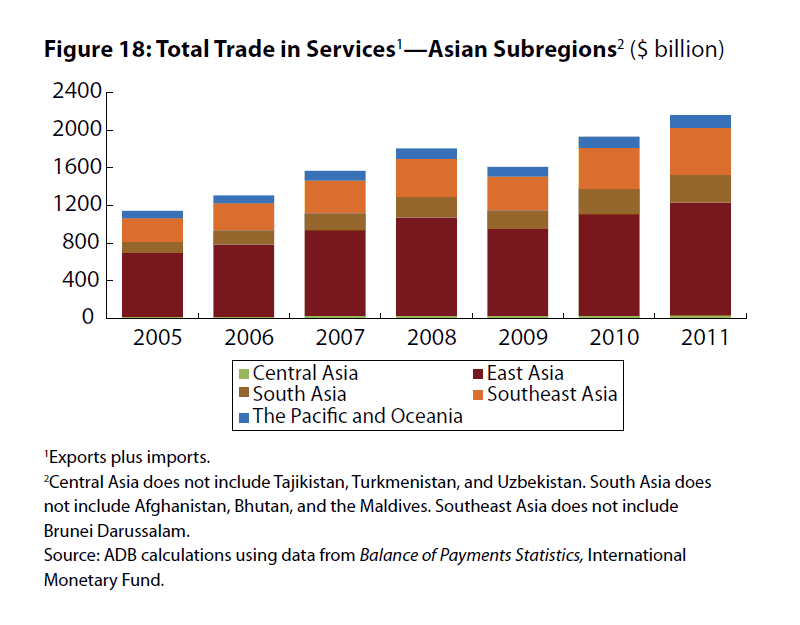
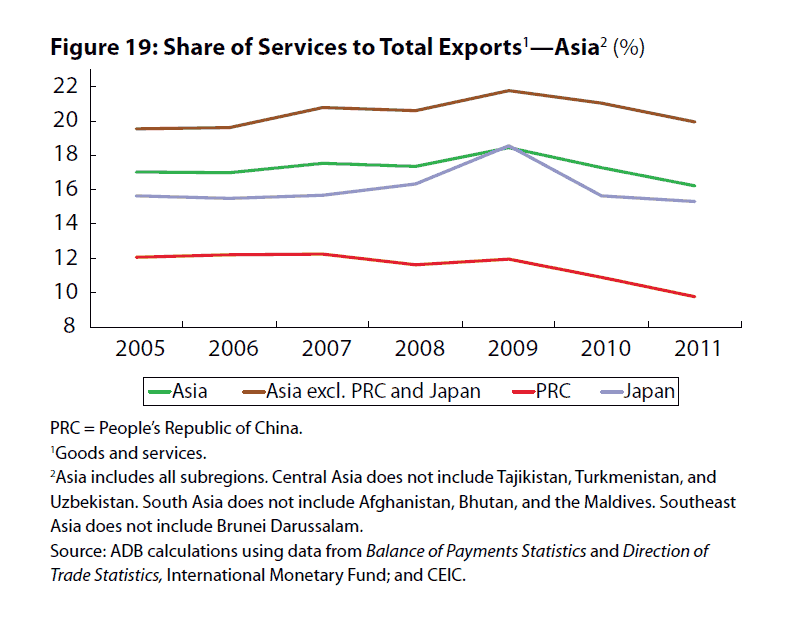
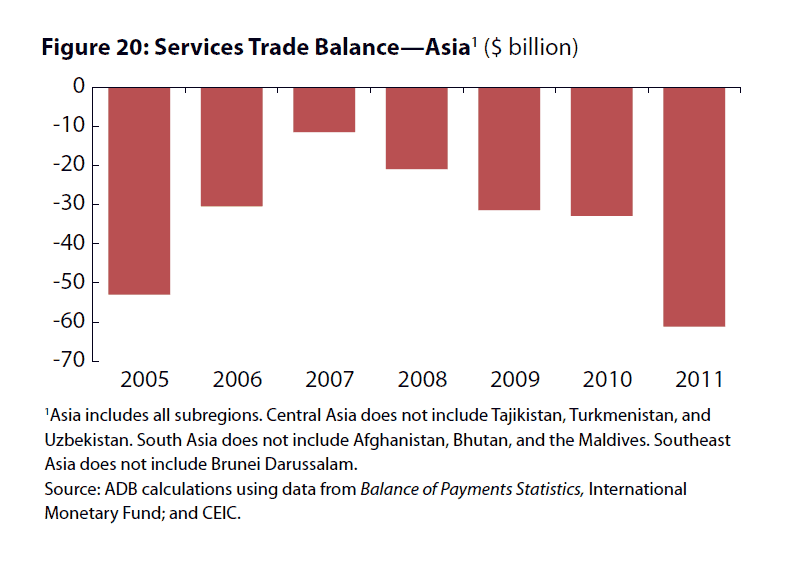
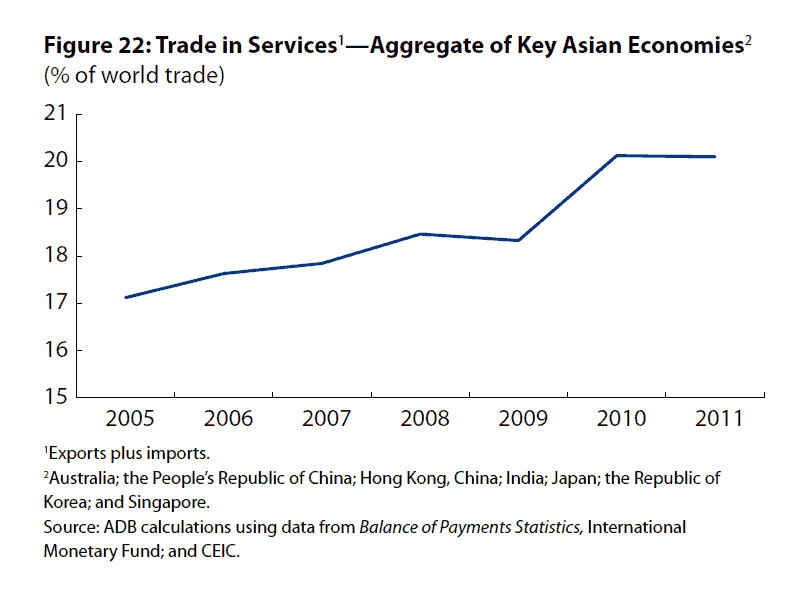
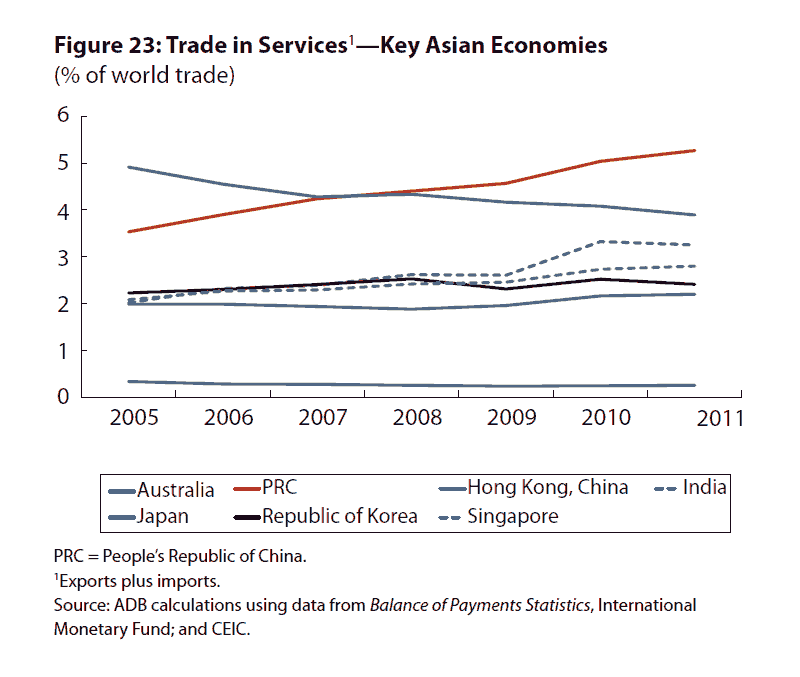
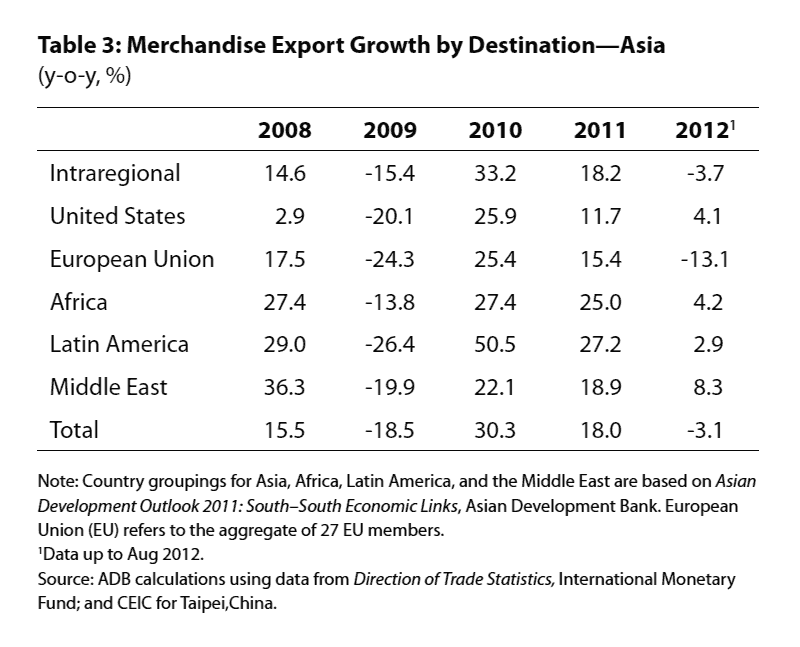
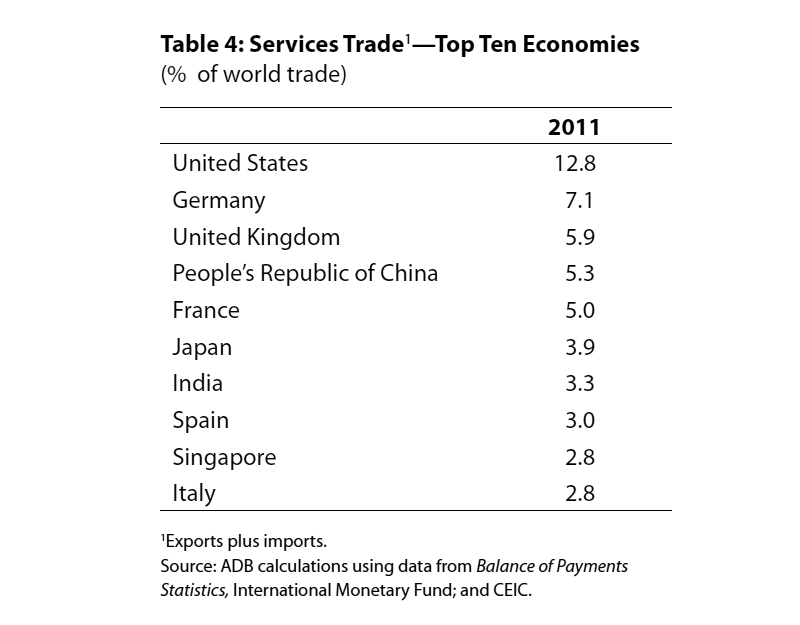
Boxes Chart | Data Box 3: Total Trade Growth—Asia Chart | Data Box 3: Share of Services to Total Exports—Asia Charts Chart | Data Figure 15: Merchandise Exports During Crisis—Asia Chart | Data Figure 16: Merchandise Exports by Destination—Asia Chart | Data Figure 17: Intra-subregional Trade Share—Asia Chart | Data Figure 18: Total Trade in Services—Asian Subregions Chart | Data Figure 19: Share of Services to Total Exports—Asia Chart | Data Figure 20: Services Trade Balance—Asia Chart | Data Figure 21: Services Trade Balance—Selected Asian Economies, 2011 Chart | Data Figure 22: Trade in Services—Aggregate of Key Asian Economies Chart | Data Figure 23: Trade in Services—Key Asian Economies Tables Chart | Data Table 3: Merchandise Export Growth by Destination—Asia Chart | Data Table 4: Services Trade—Top Ten Economies -
Financial Integration
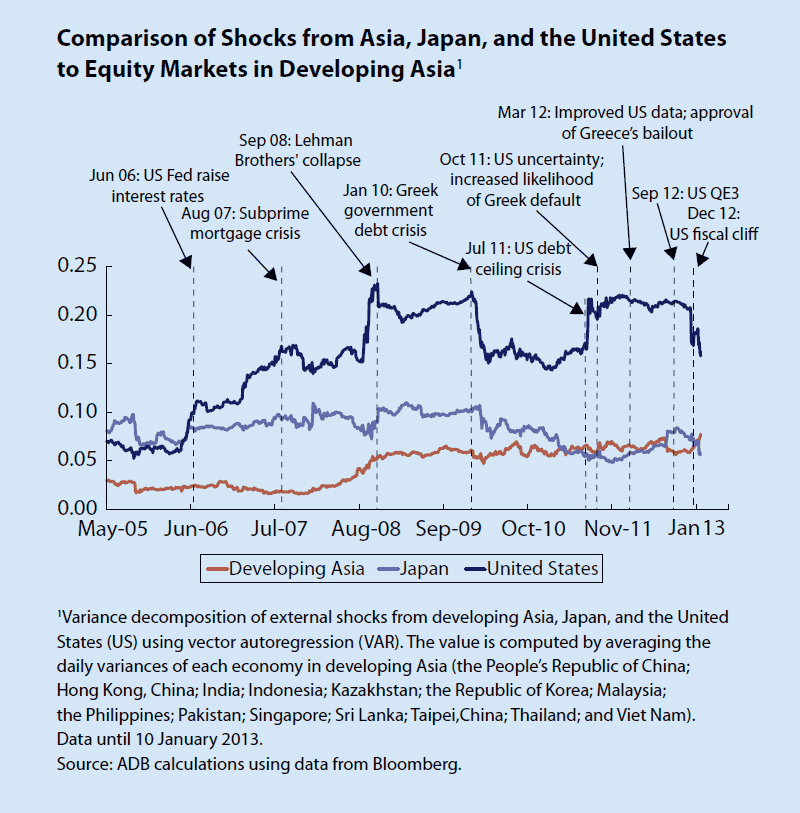
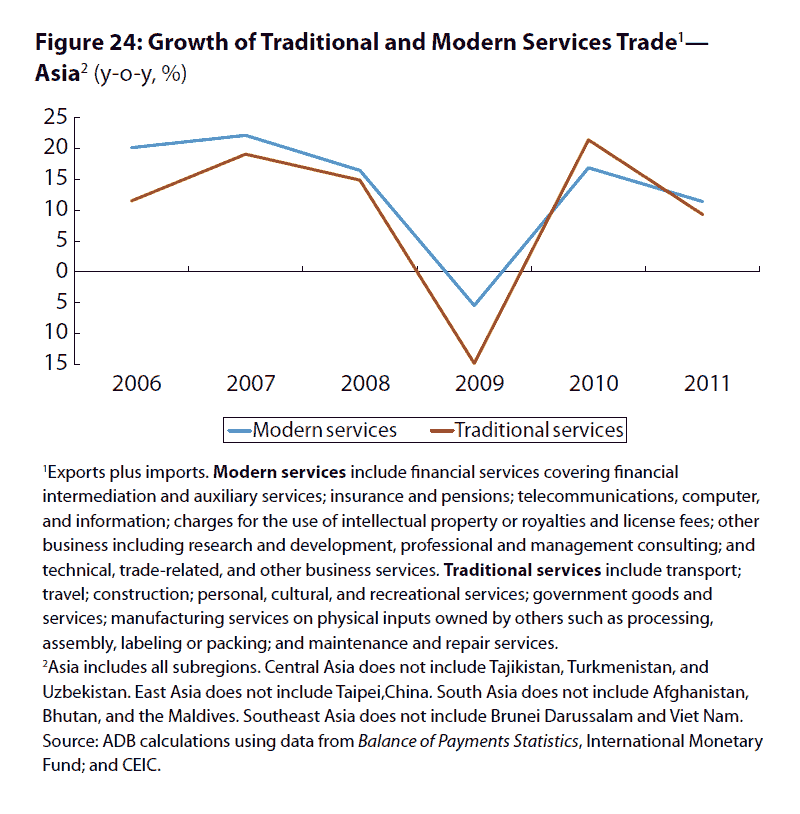
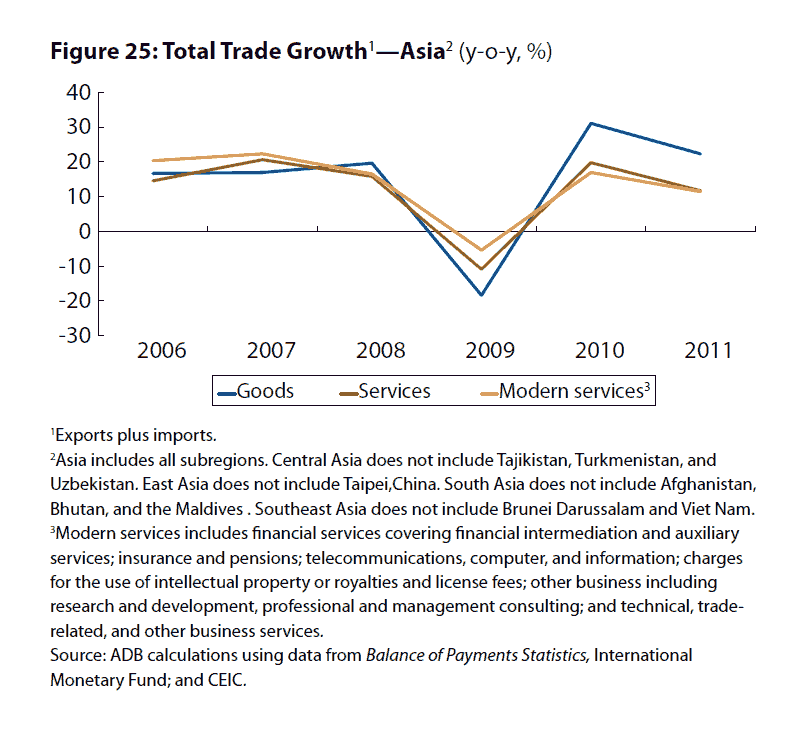
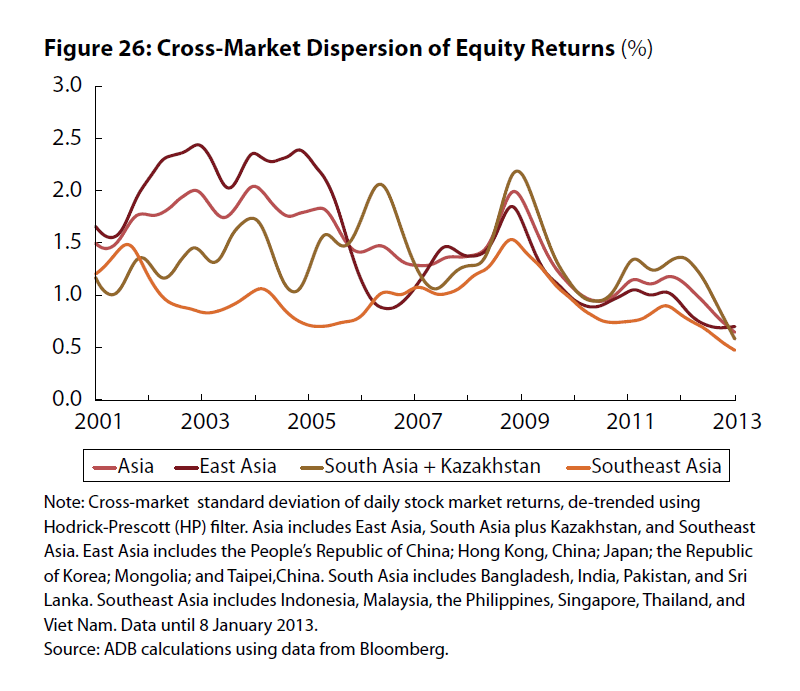
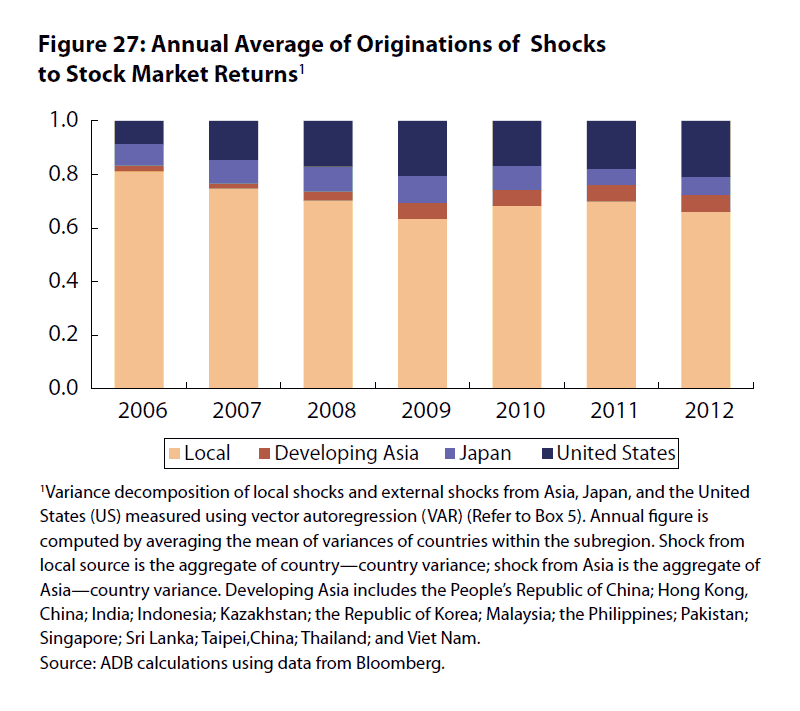
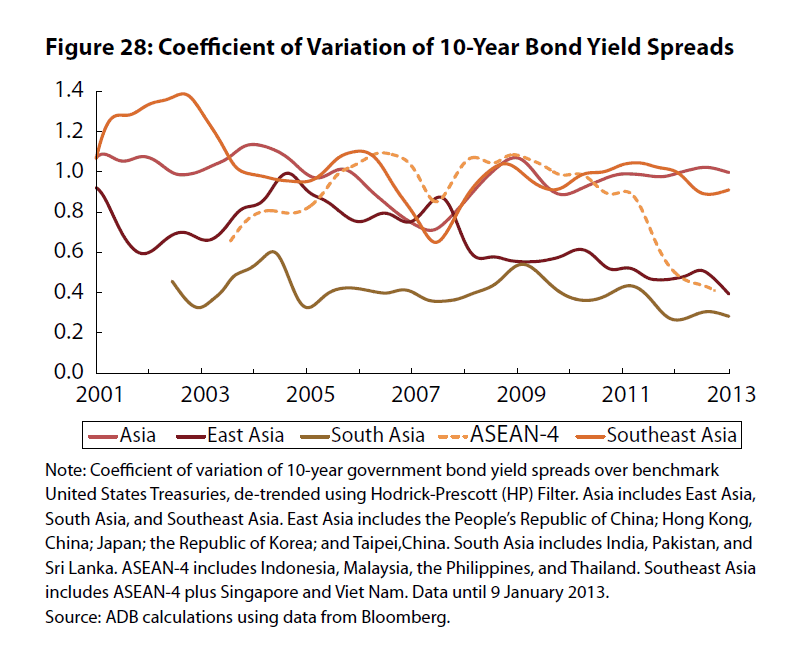
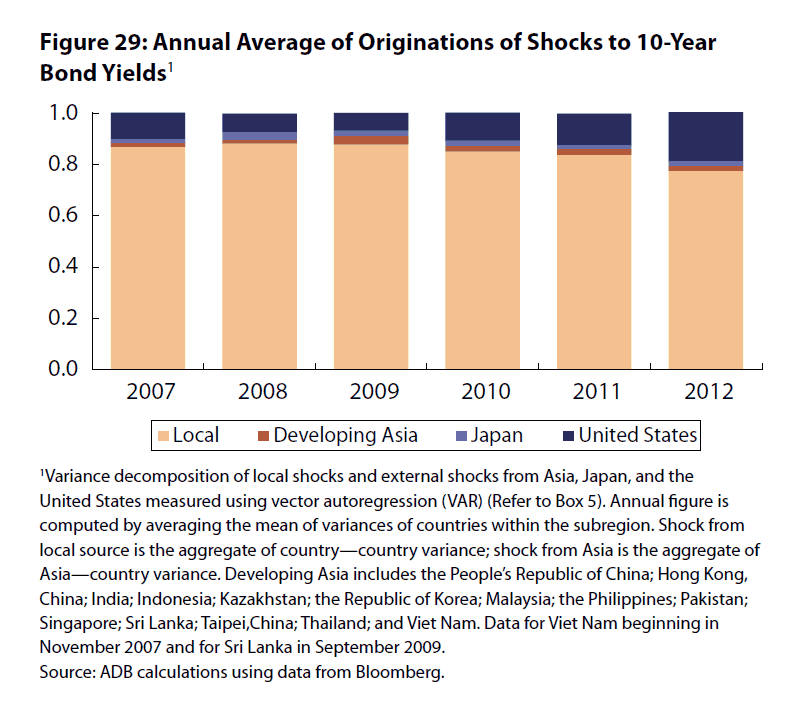
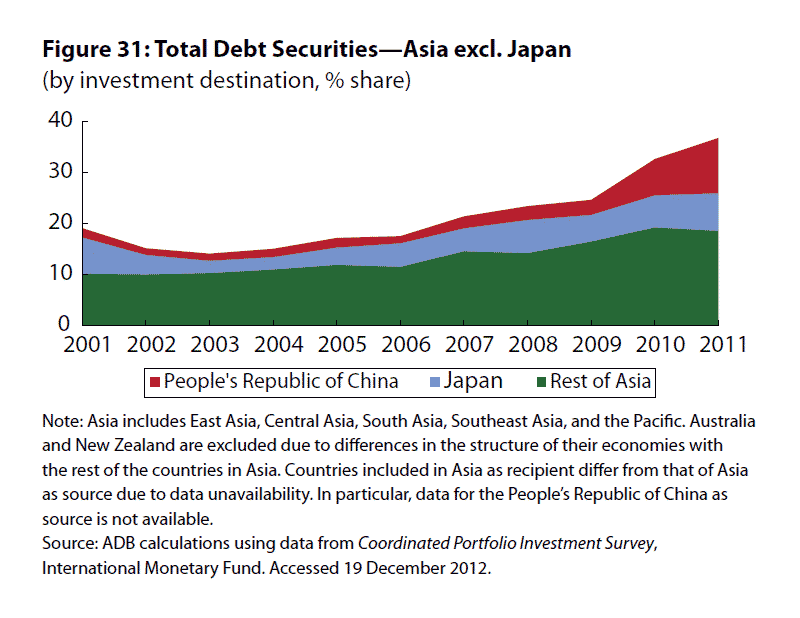
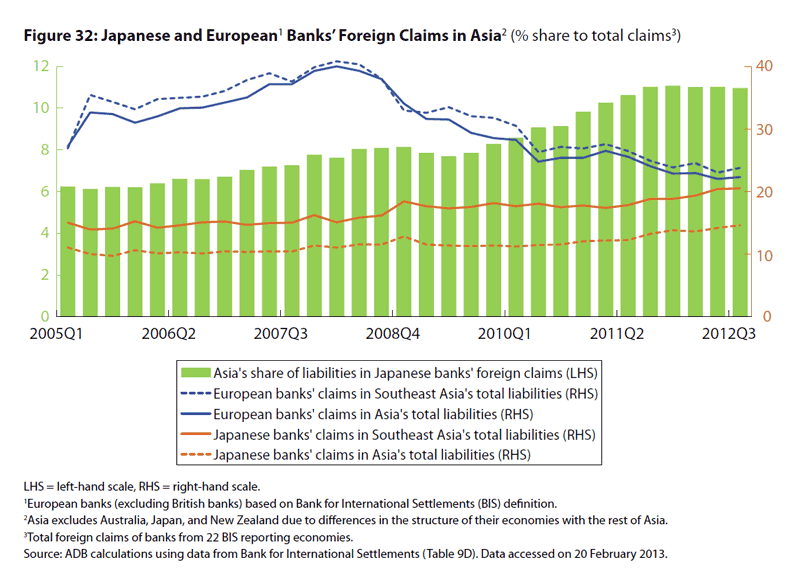
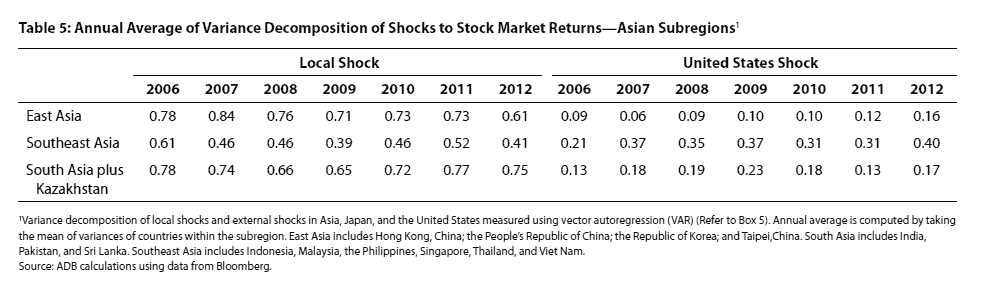
Boxes Chart | Data Box 5: Comparison of Shocks from Asia, Japan, and the United States to Equity Markets in Developing Asia Charts Chart | Data Figure 24: Growth of Traditional and Modern Services Trade—Asia Chart | Data Figure 25: Total Trade Growth—Asia Chart | Data Figure 26: Cross-Market Dispersion of Equity Returns Chart | Data Figure 27: Annual Average of Originations of Shocks to Stock Market Returns Chart | Data Figure 28: Coefficient of Variation of 10-Year Bond Yield Spreads Chart | Data Figure 29: Annual Average of Originations of Shocks to 10-Year Bond Yields Chart | Data Figure 30: Portfolio Holdings—Asia Chart | Data Figure 31: Total Debt Securities—Asia excl. Japan Chart | Data Figure 32: Japanese and European Banks’ Foreign Claims in Asia Tables Chart | Data Table 5: Annual Average of Variance Decomposition of Shocks to Stock Market Returns—Asian Subregions Chart | Data Table 6: Annual Average of Variance Decomposition of Shocks to 10-Year Bond Yields—Asian Subregions -
Macroeconomic Interdependence
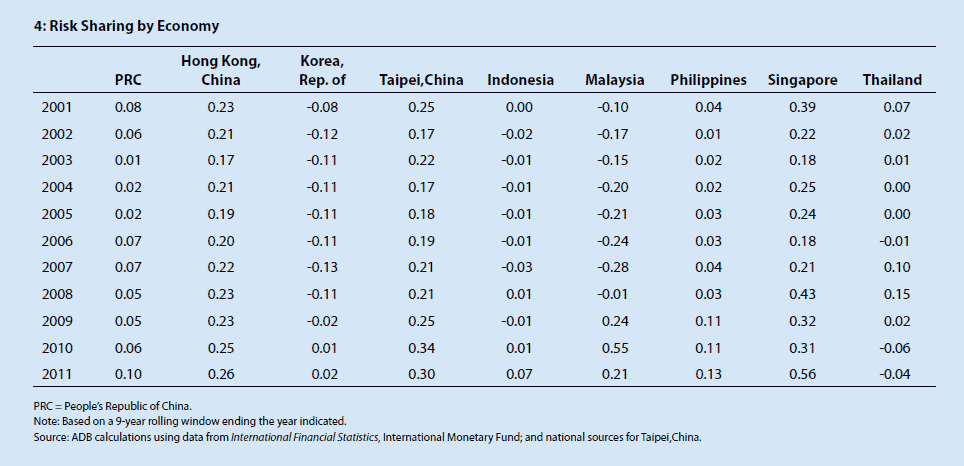
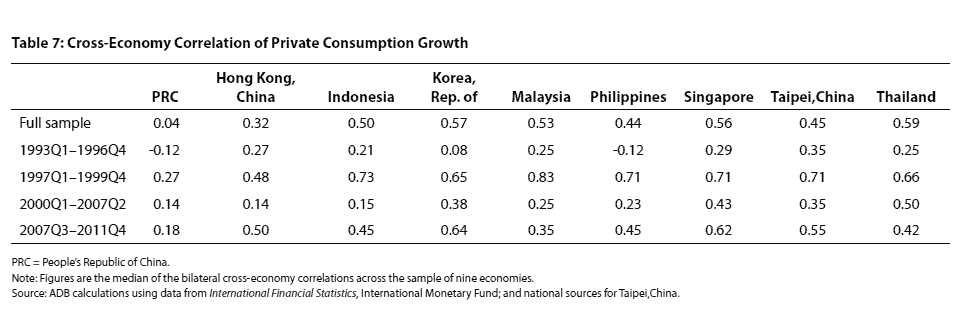
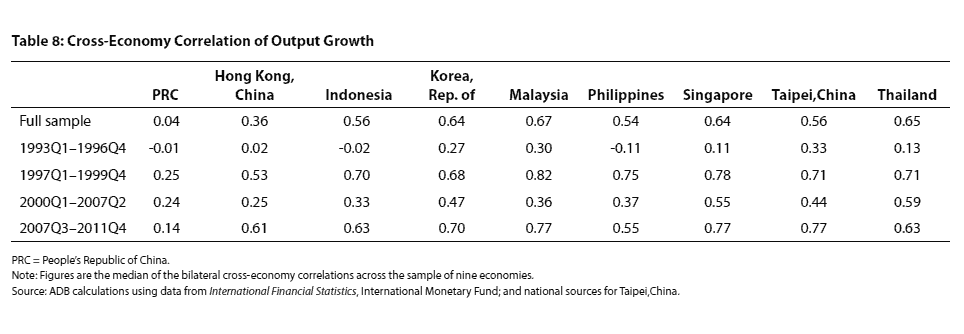
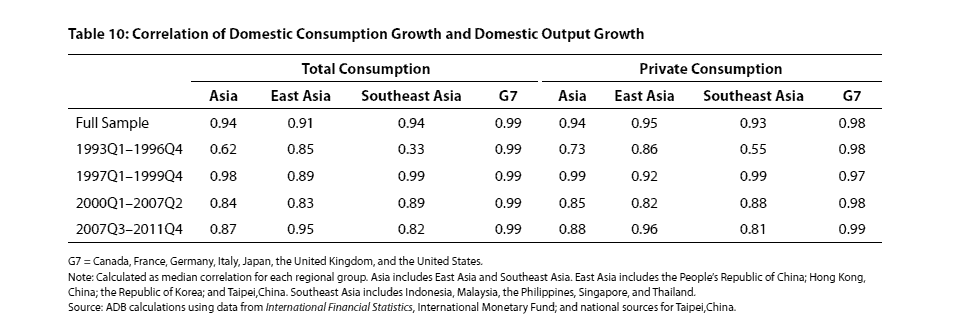
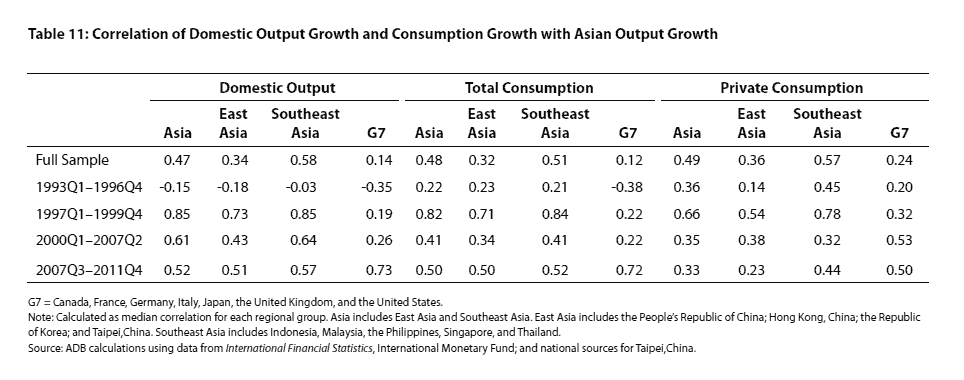
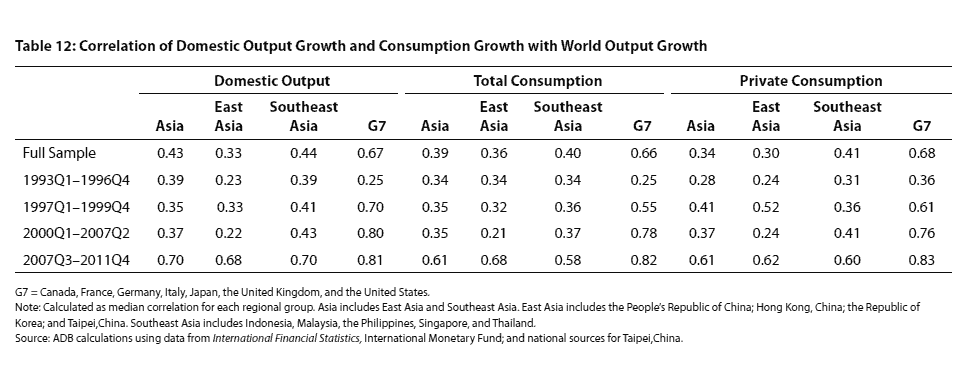
Boxes Chart | Data Box 6: 1: Dependent Variable—Domestic Consumption Growth (Net of G7 Consumption Growth) by period Chart | Data Box 6: 2: Dependent Variable—Domestic Consumption Growth (Net of G7 Consumption Growth), by year Chart | Data Box 6: 3: Dependent Variable—Domestic Consumption Growth (Net of G7 Consumption Growth), by region and period Chart | Data Box 6: 4: Risk Sharing by Economy Tables Chart | Data Table 7: Cross-Economy Correlation of Private Consumption Growth Chart | Data Table 8: Cross-Economy Correlation of Output Growth Chart | Data Table 9: Difference Between Cross-Economy Correlation of Consumption Growth and Output Growth Chart | Data Table 10: Correlation of Domestic Consumption Growth and Domestic Output Growth Chart | Data Table 11: Correlation of Domestic Output Growth and Consumption Growth with Asian Output Growth Chart | Data Table 12: Correlation of Domestic Output Growth and Consumption Growth with World Output Growth -
Labor Mobility
-
Infrastructure Connectivity
-
Provision of Regional Public Goods
-
Macroeconomic and Financial Cooperation
Special Chapter—Multilateralizing Asian Regionalism:
Approaches to Unraveling the Asian Noodle Bowl
Complete Report
July 2012
Cover and Highlights
Part I: Regional Economic Update
| Charts | |
| Chart | Data | Figure 1: 10-year Government Bond Yields |
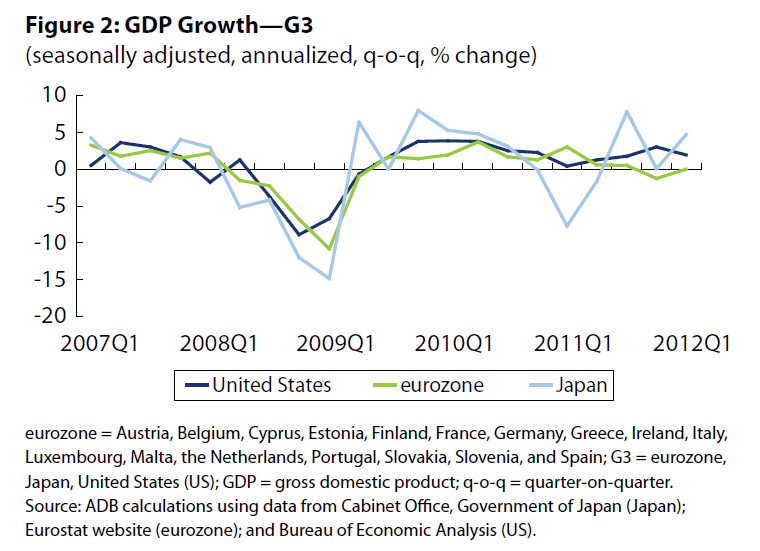
| Chart | Data | Figure 2: GDP Growth—G3 |
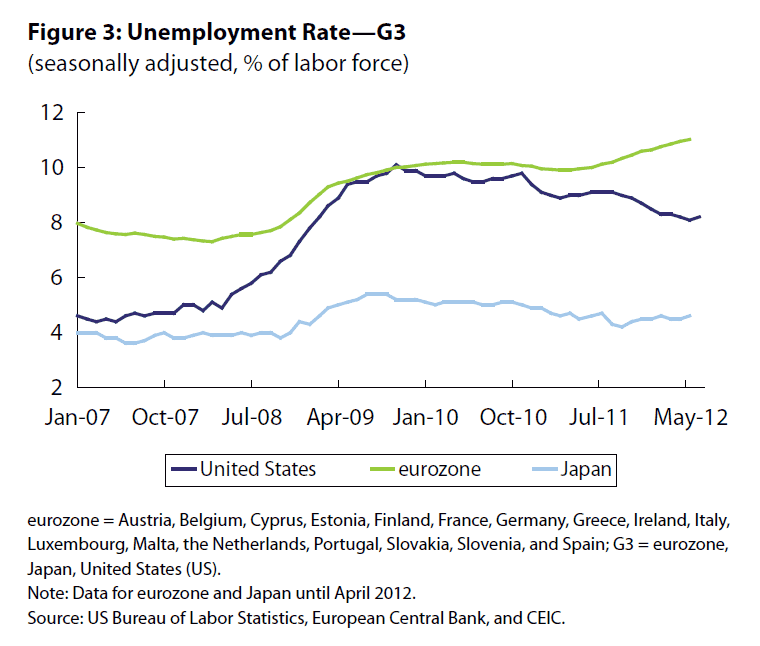
| Chart | Data | Figure 3: Unemployment Rate—G3 |
| Chart | Data | Figure 4: Manufacturing Purchasing Managers’ Index—G3 |
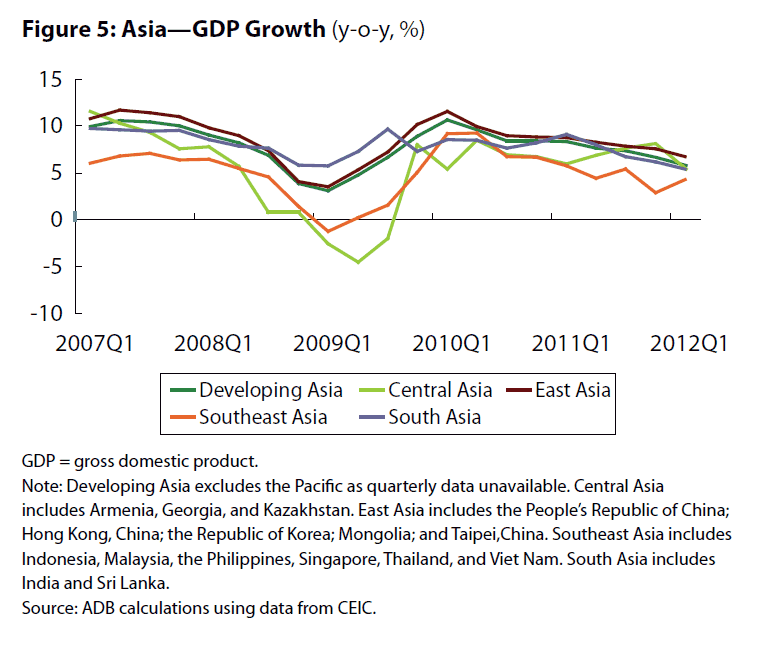
| Chart | Data | Figure 5: Asia—GDP Growth |
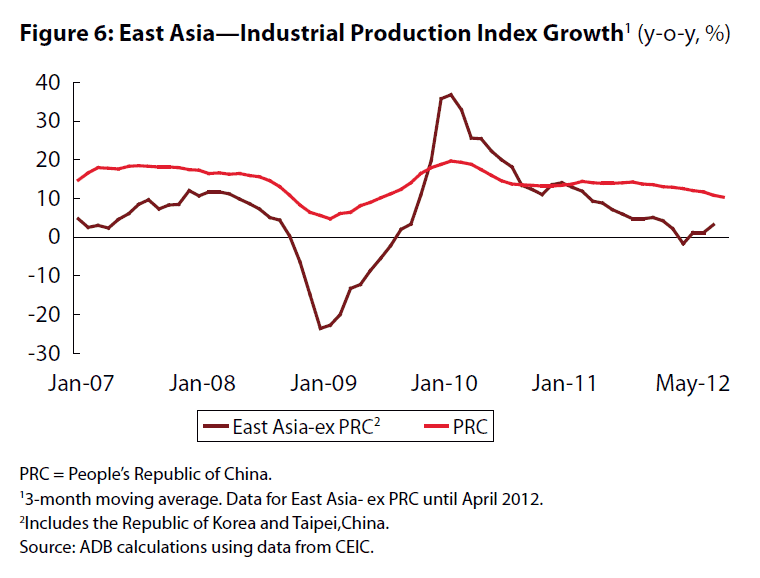
| Chart | Data | Figure 6: East Asia—Industrial Production Index Growth |
| Chart | Data | Figure 7: East Asia—Merchandise Export and Retail Sales Growth |
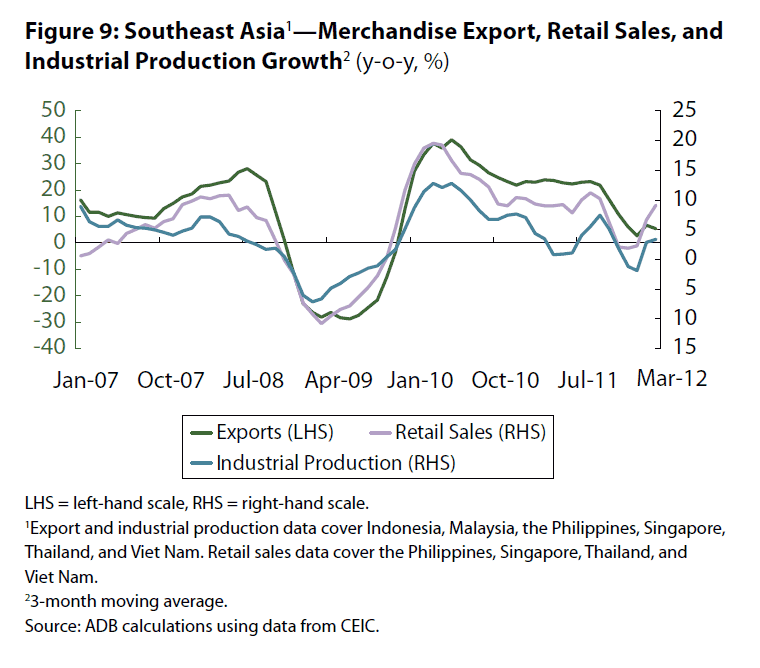
| Chart | Data | Figure 8: Southeast Asia—Merchandise Export, Retail Sales, and Industrial Production Growth |
| Chart | Data | Figure 9: East Asia—Manufacturing Purchasing Managers’ Index |
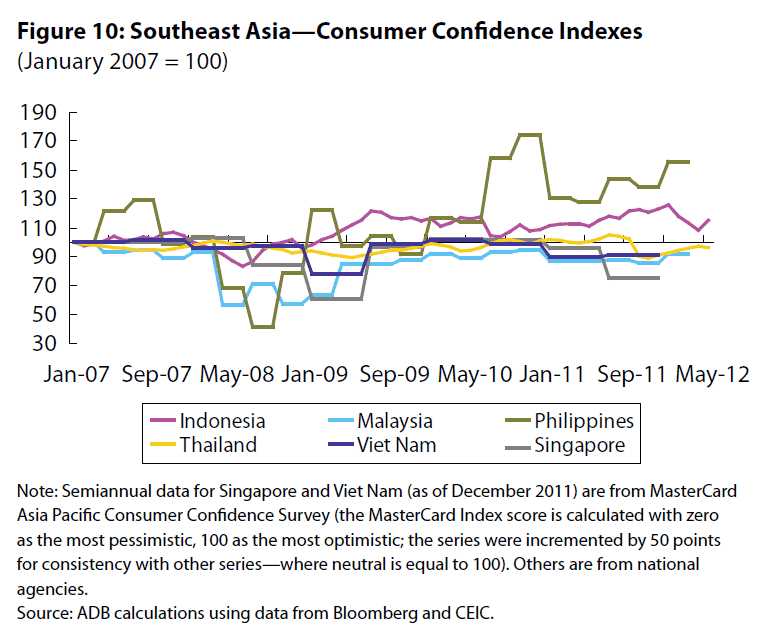
| Chart | Data | Figure 10: Southeast Asia—Consumer Confidence Indexes |
| Chart | Data | Figure 11: South Asia—Trade Deficit and Growth of Exports and Imports |
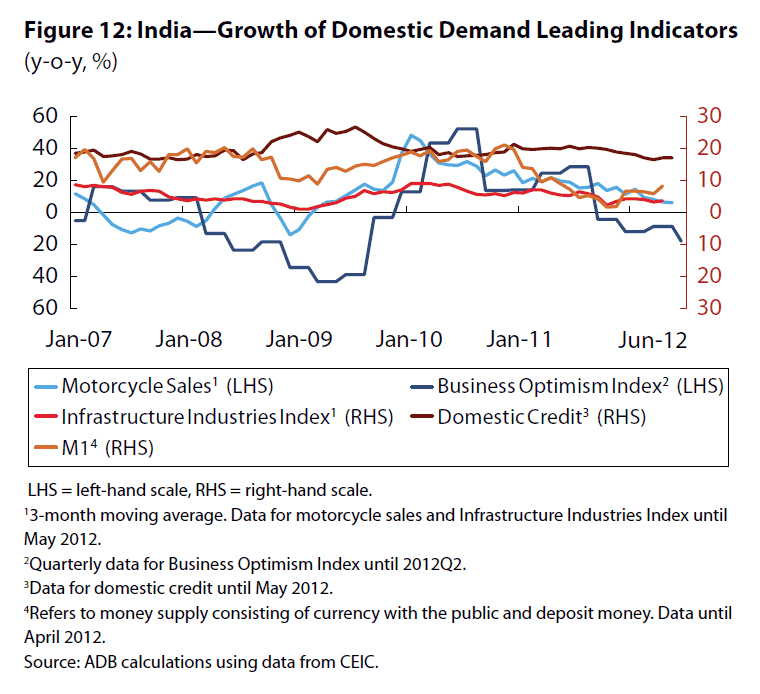
| Chart | Data | Figure 12: India—Growth of Domestic Demand Leading Indicators |
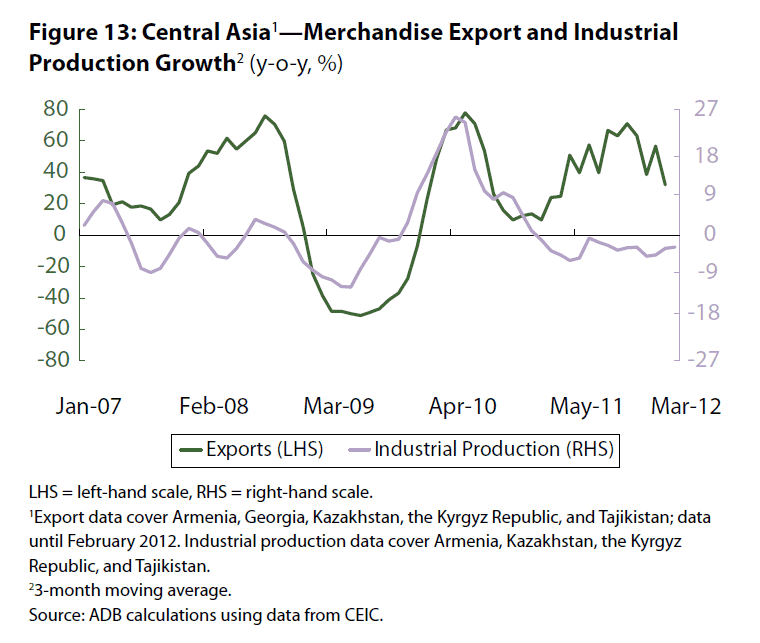
| Chart | Data | Figure 13: Central Asia—Merchandise Export and Industrial Production Growth | Tables |
| Chart | Data | Table 1: Regional GDP Growth |
Part II: Progress in Regional Cooperation and Integration
-
Introduction
-
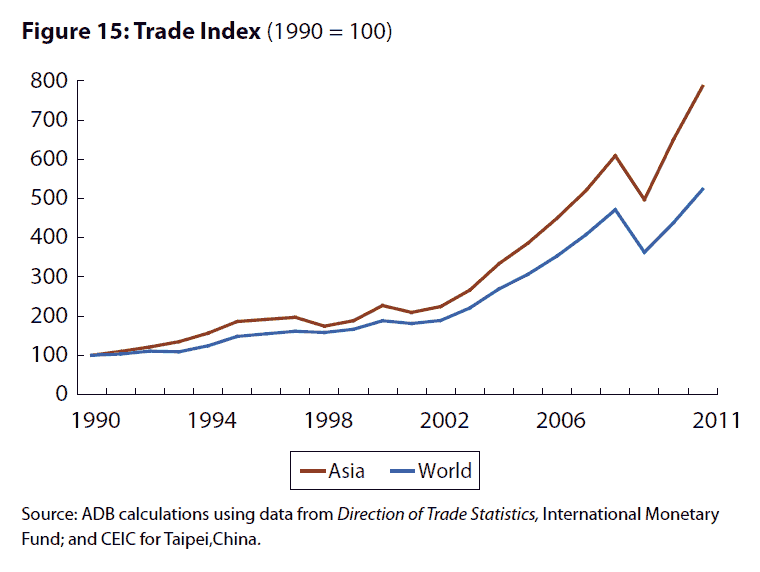
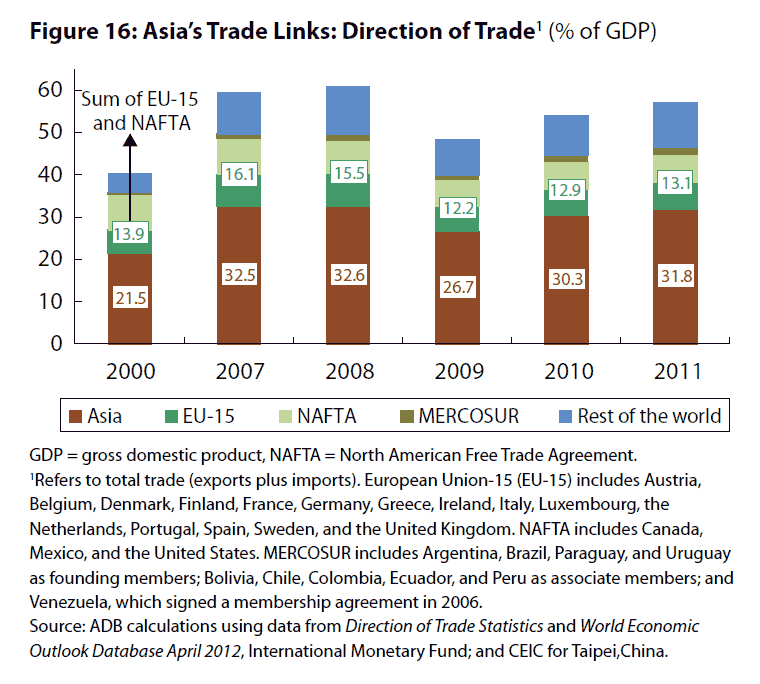
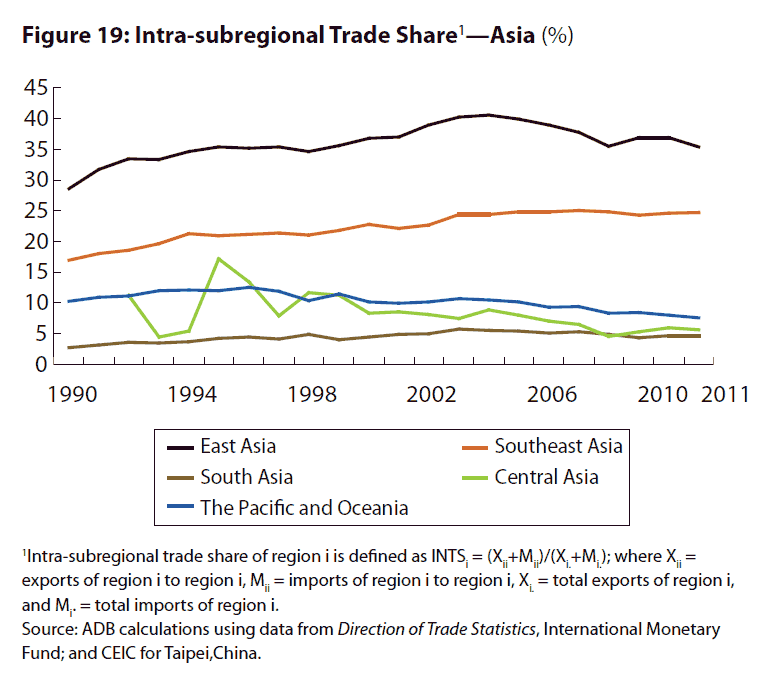
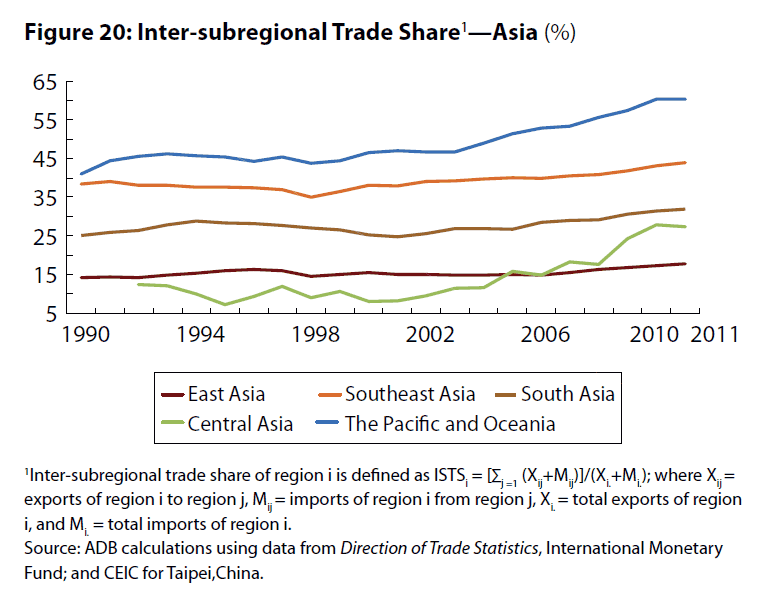
Production Networks and Trade
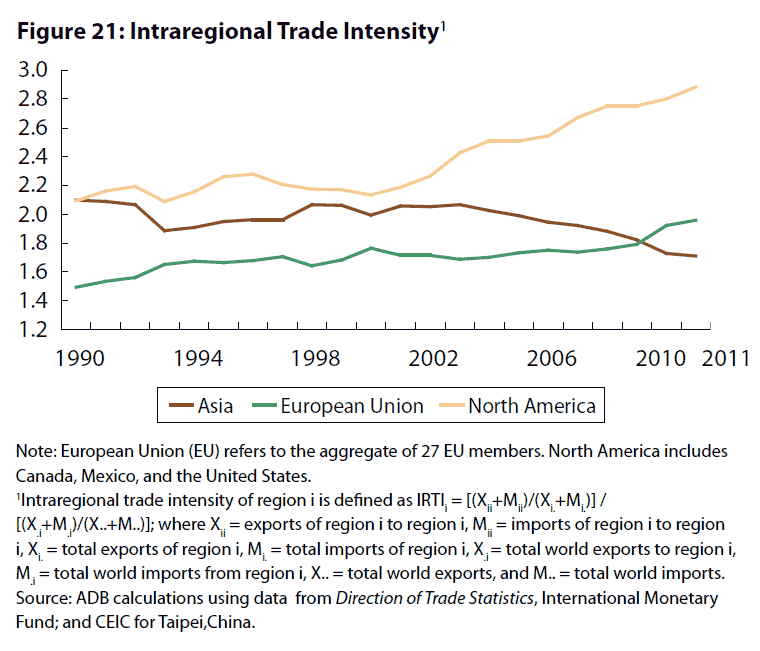
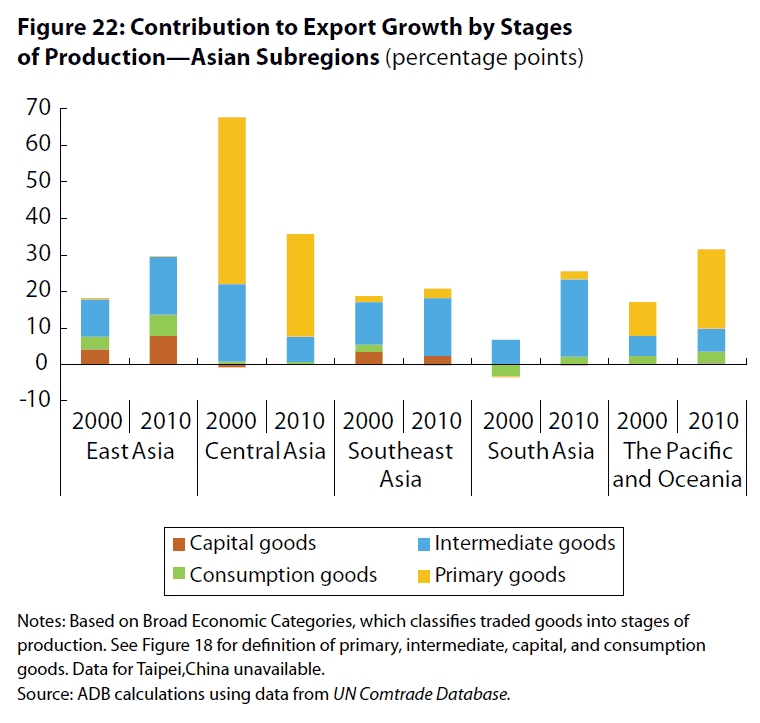
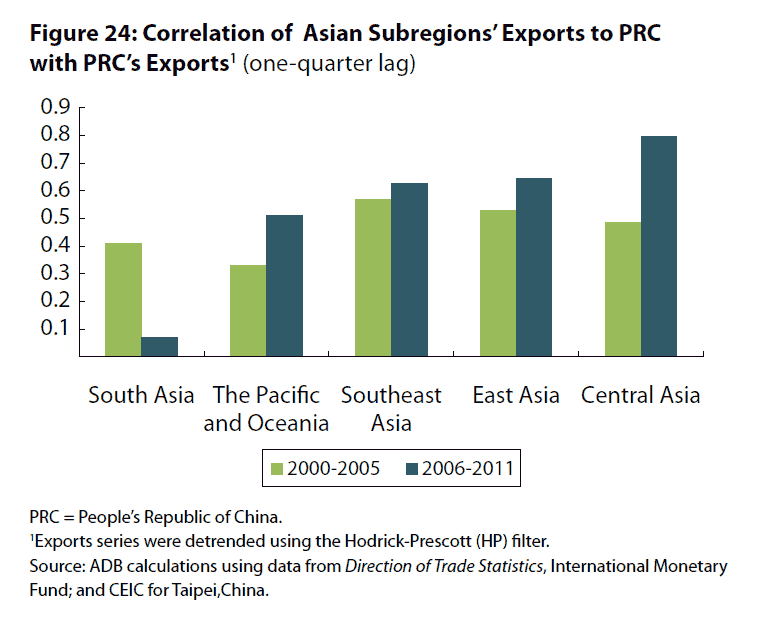
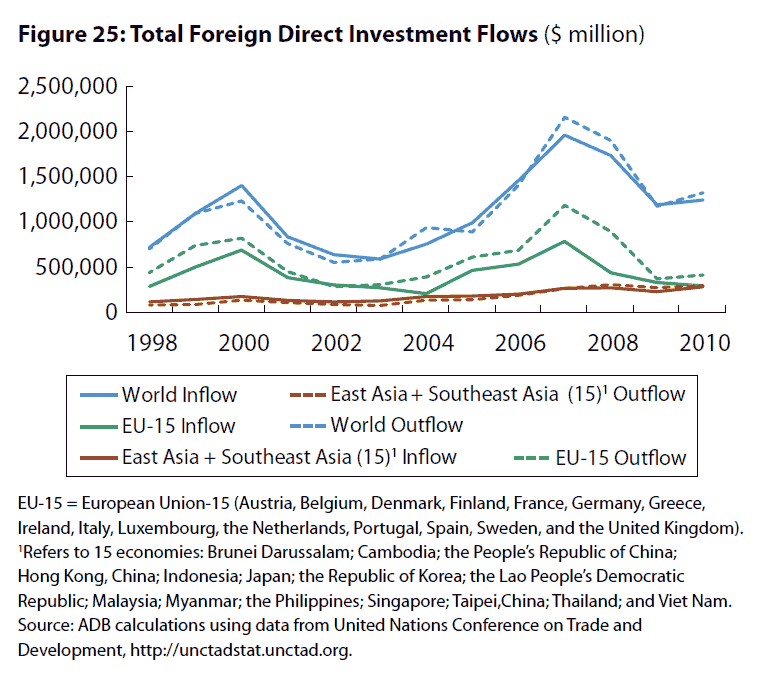
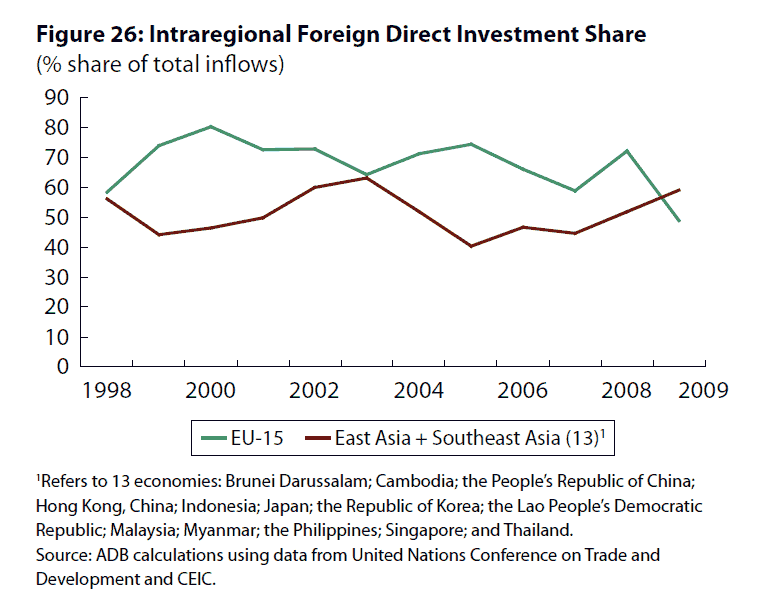
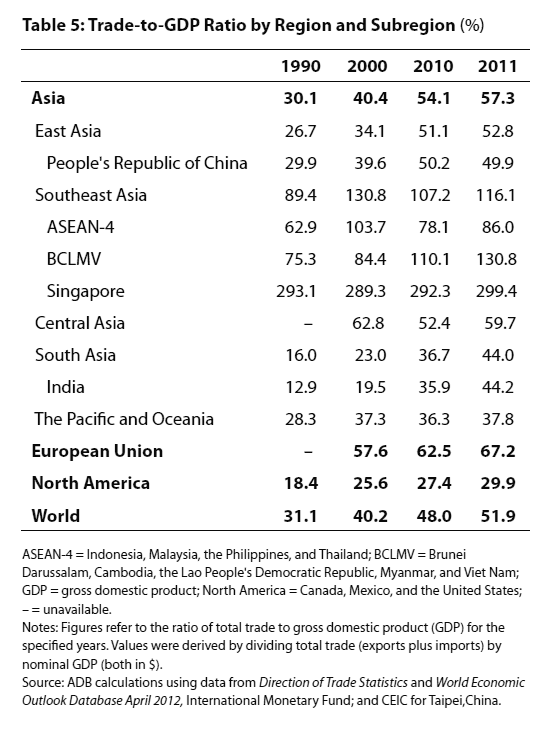
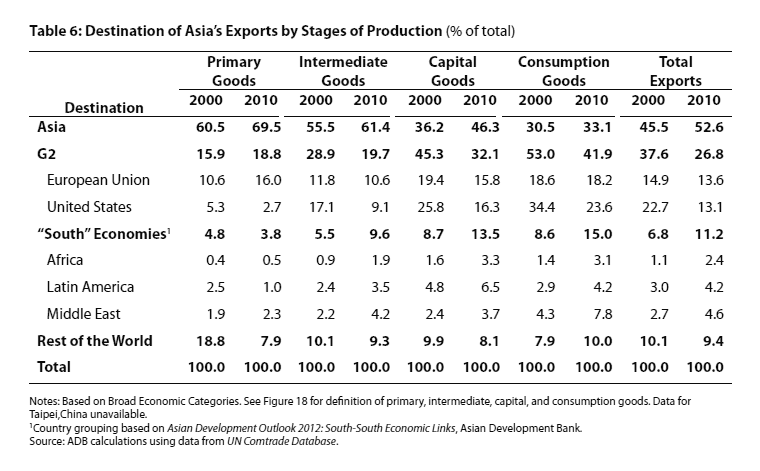
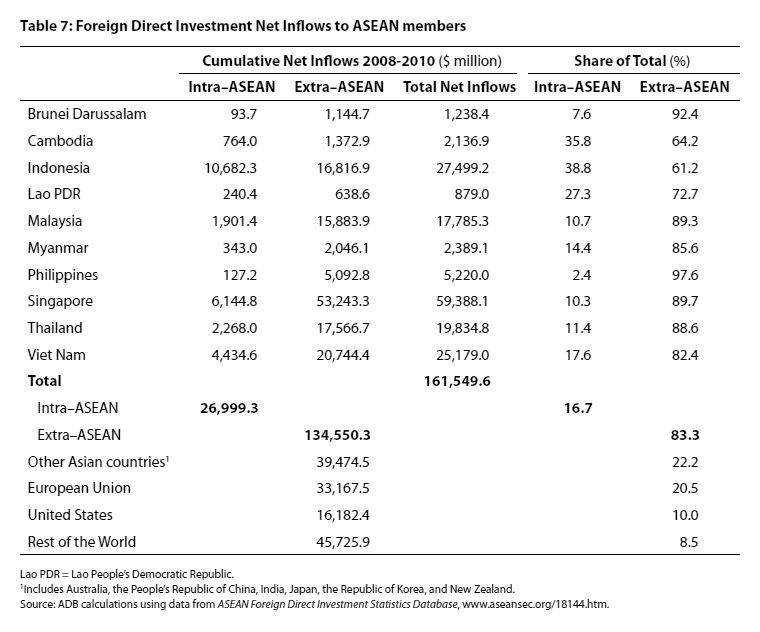
Charts Chart | Data Figure 15: Trade Index Chart | Data Figure 16: Asia’s Trade Links: Direction of Trade Chart | Data Figure 17: Intraregional Trade Share—World Chart | Data Figure 18: Contribution to Export Growth by Stages of Production—Asia Chart | Data Figure 19: Intra-subregional Trade Share—Asia Chart | Data Figure 20: Inter-subregional Trade Share—Asia Chart | Data Figure 21: Intraregional Trade Intensity Chart | Data Figure 22: Contribution to Export Growth by Stages of Production—Asian Subregions Chart | Data Figure 23: Exports to G2 and the PRC—Asia Chart | Data Figure 24: Correlation of Asian Subregions’ Exports to PRC with PRC’s Exports Chart | Data Figure 25: Total Foreign Direct Investment Flows Chart | Data Figure 26: Intraregional Foreign Direct Investment Share Tables Chart | Data Table 5: Trade-to-GDP Ratio by Region and Subregion Chart | Data Table 6: Destination of Asia’s Exports by Stages of Production Chart | Data Table 7: Foreign Direct Investment Net Inflows to ASEAN members -
Financial Integration
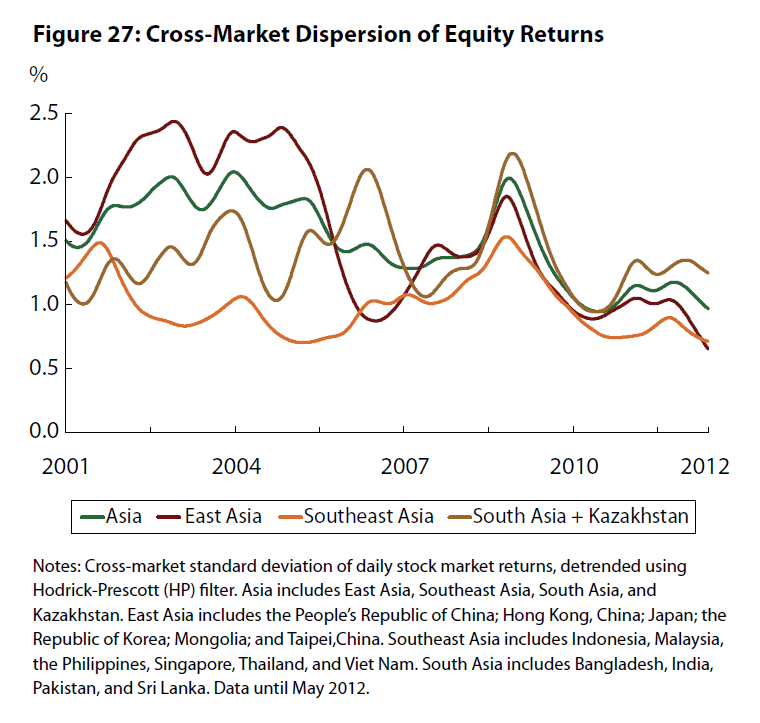
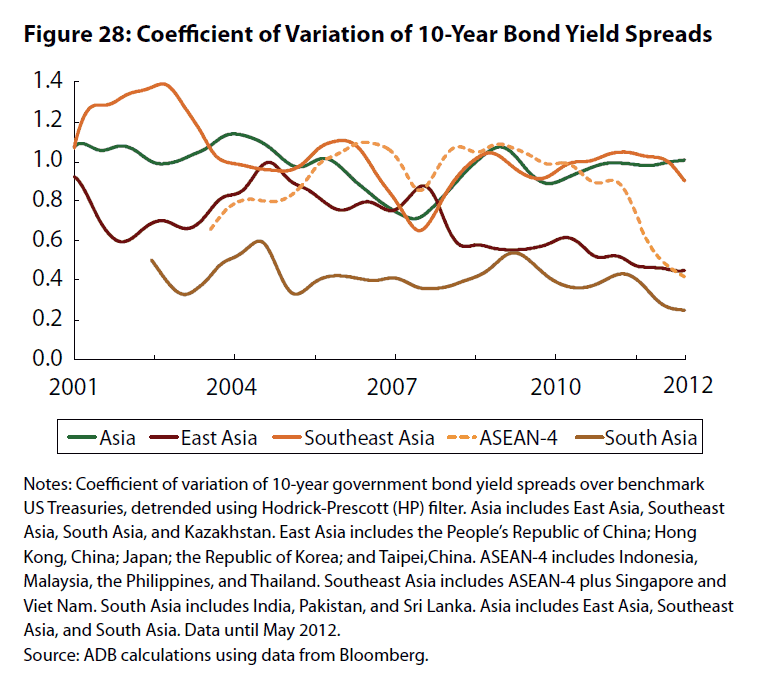
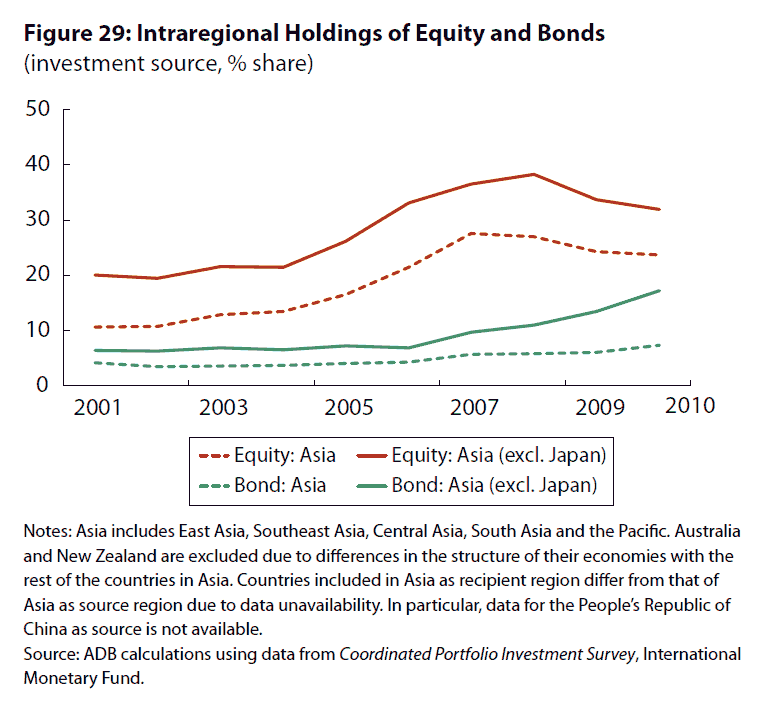
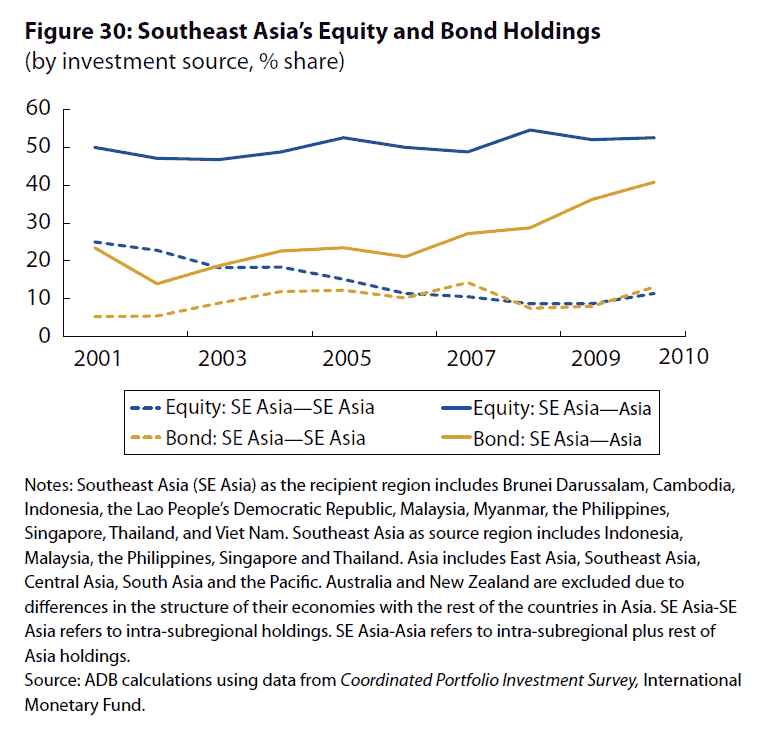
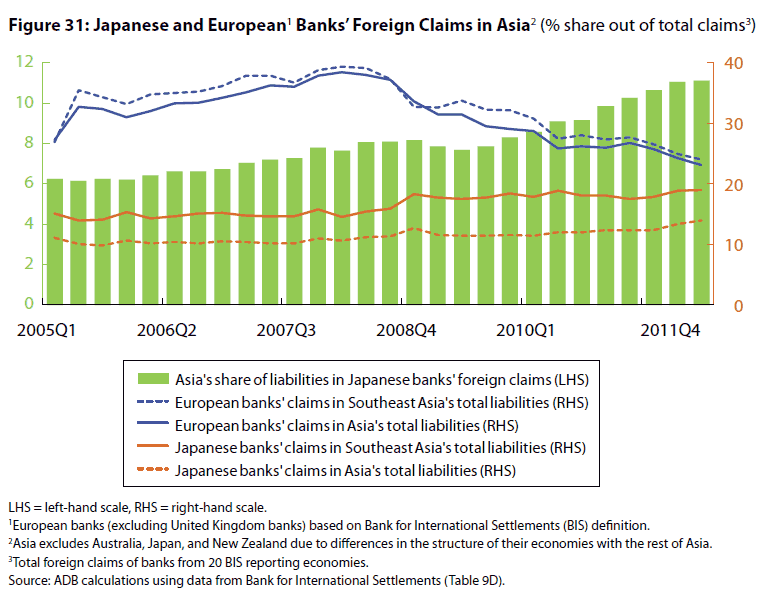
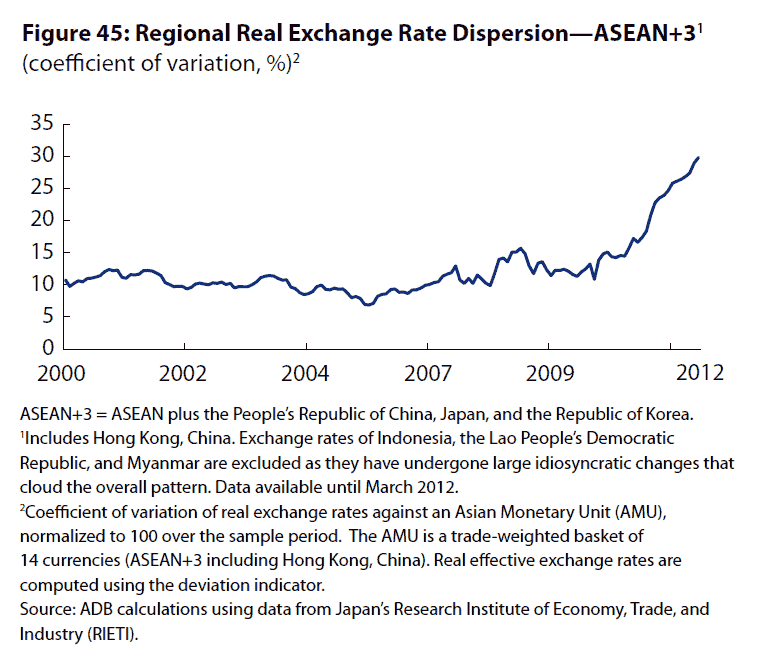
Charts Chart | Data Figure 27: Cross-Market Dispersion of Equity Returns Chart | Data Figure 28: Coefficient of Variation of 10-Year Bond Yield Spreads Chart | Data Figure 29: Intraregional Holdings of Equity and Bonds Chart | Data Figure 30: Southeast Asia’s Equity and Bond Holdings Chart | Data Figure 31: Japanese and European Banks’ Foreign Claims in Asia -
Macroeconomic Interdependence
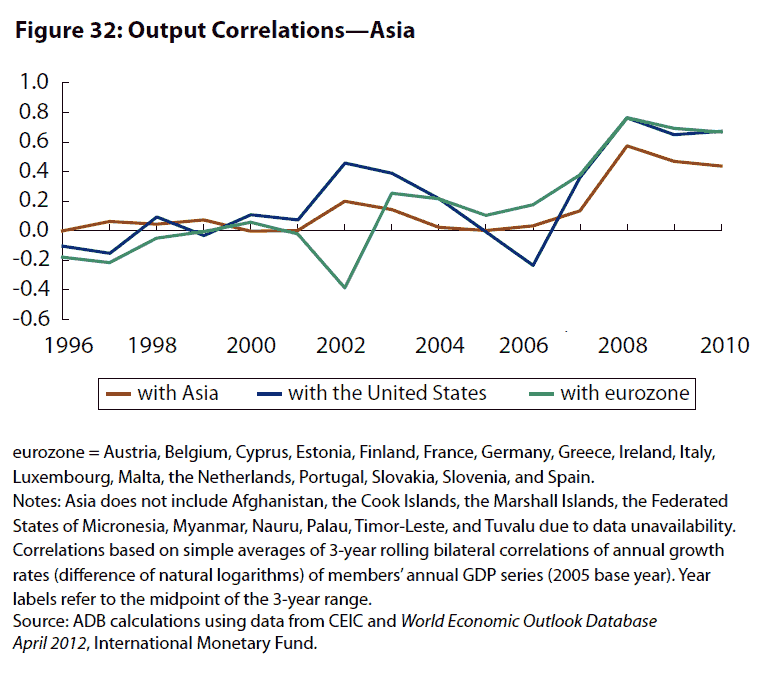
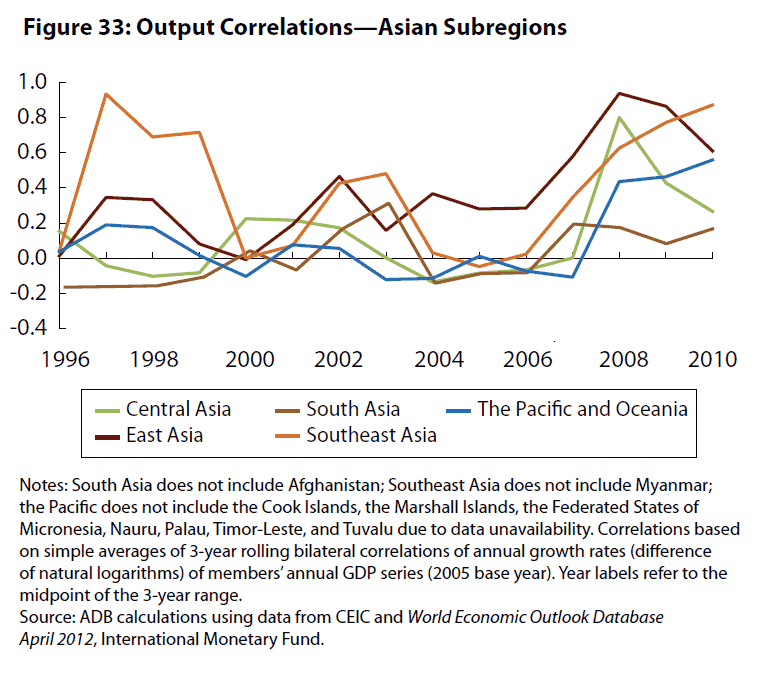
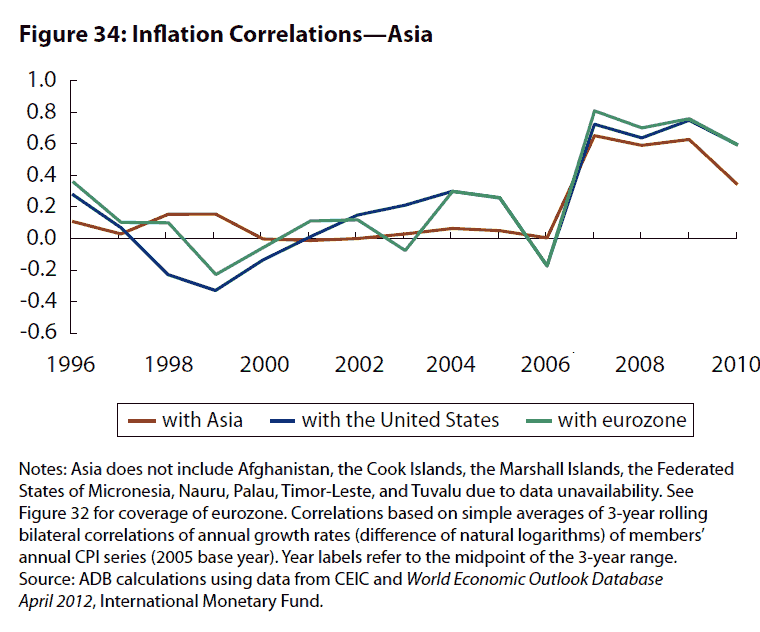
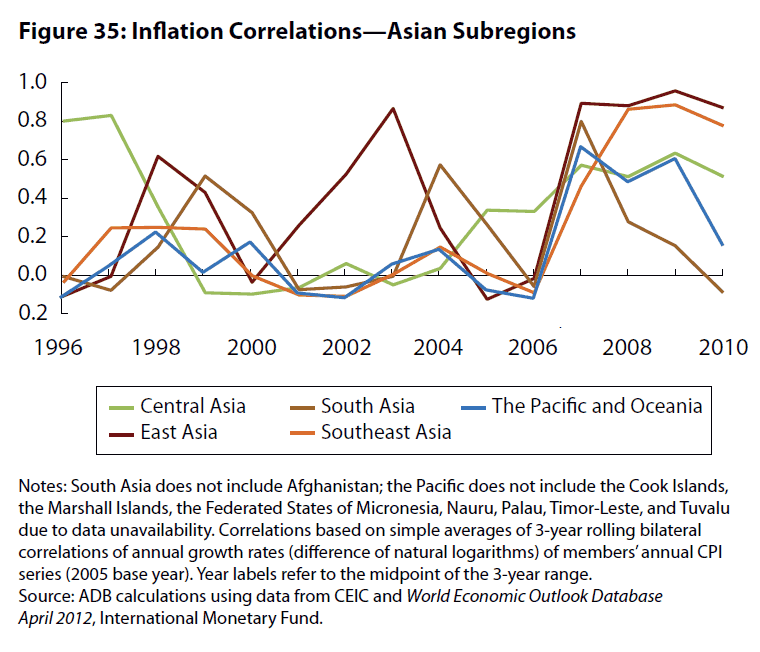
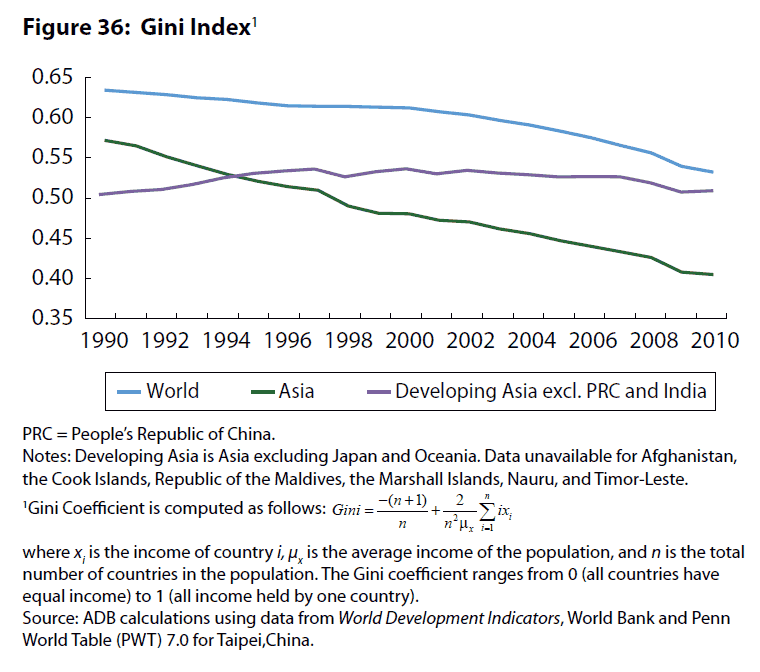
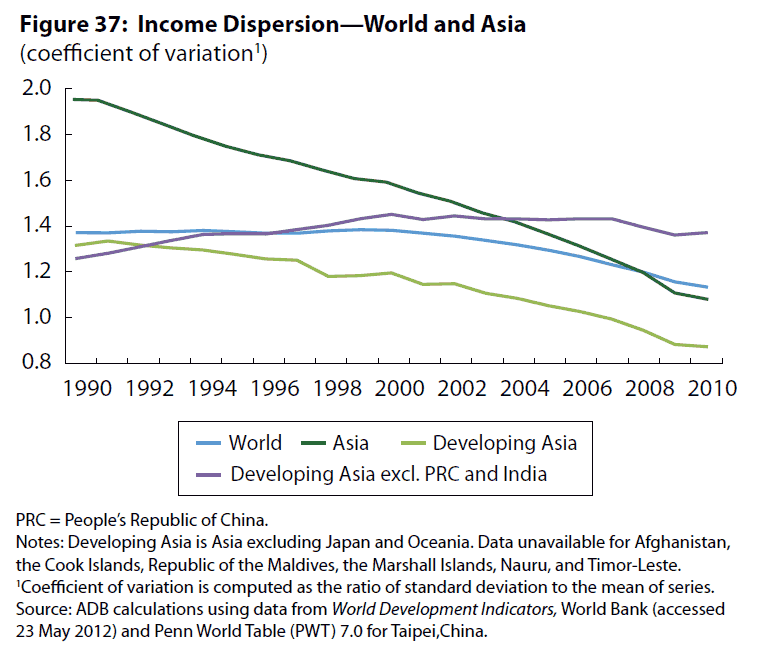
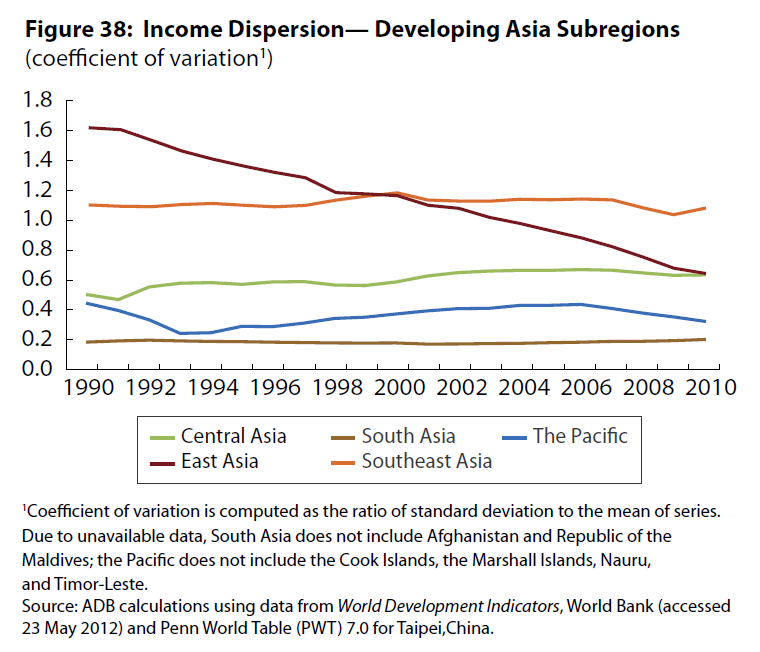
Charts Chart | Data Figure 32: Output Correlations—Asia Chart | Data Figure 33: Output Correlations—Asian Subregions Chart | Data Figure 34: Inflation Correlations—Asia Chart | Data Figure 35: Inflation Correlations—Asian Subregions Chart | Data Figure 36: Gini Index Chart | Data Figure 37: Income Dispersion—World and Asia Chart | Data Figure 38: Income Dispersion— Developing Asia Subregions -
International and Regional Transmigration
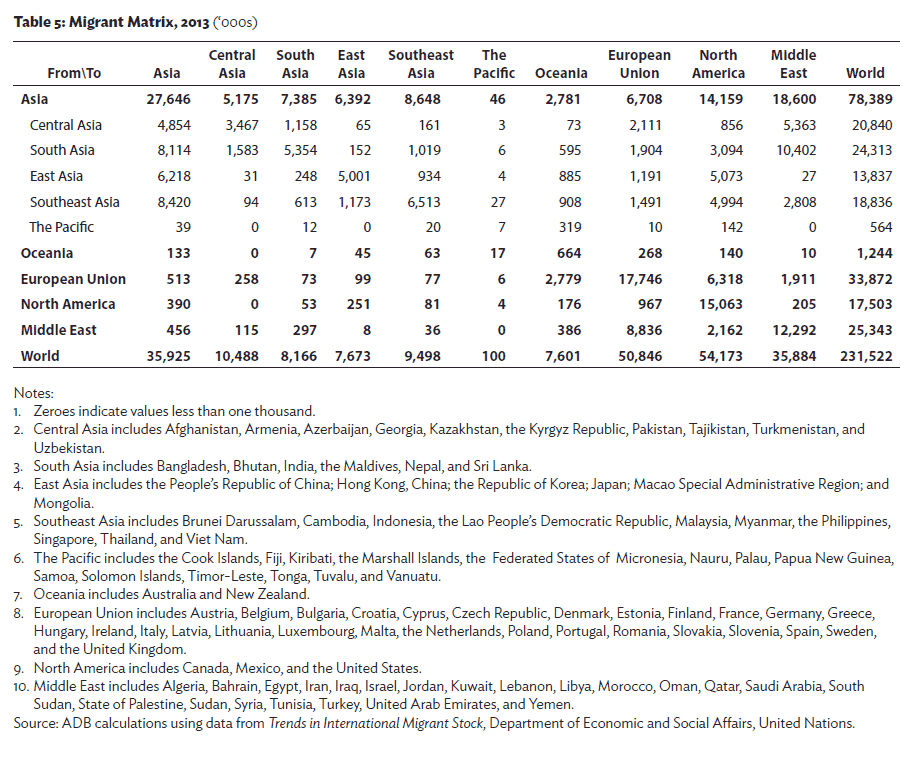
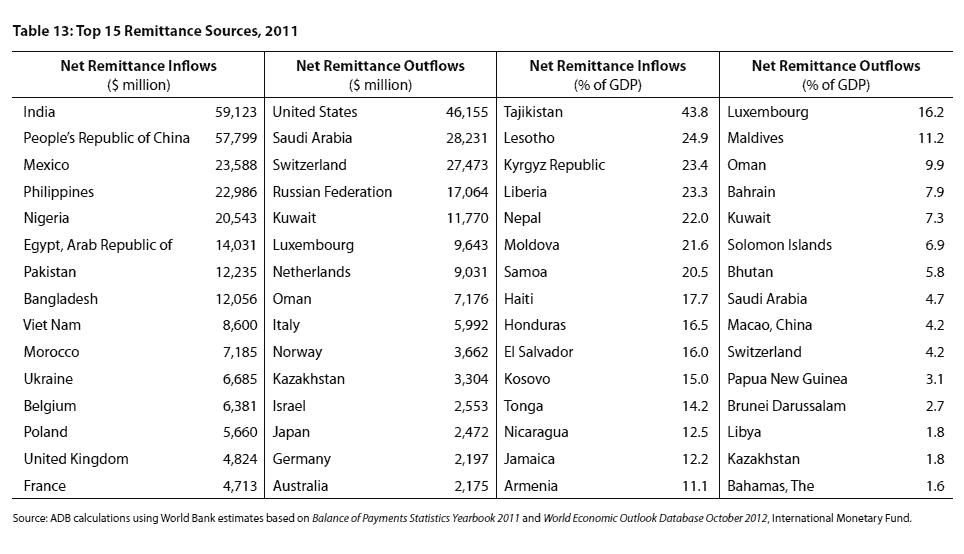
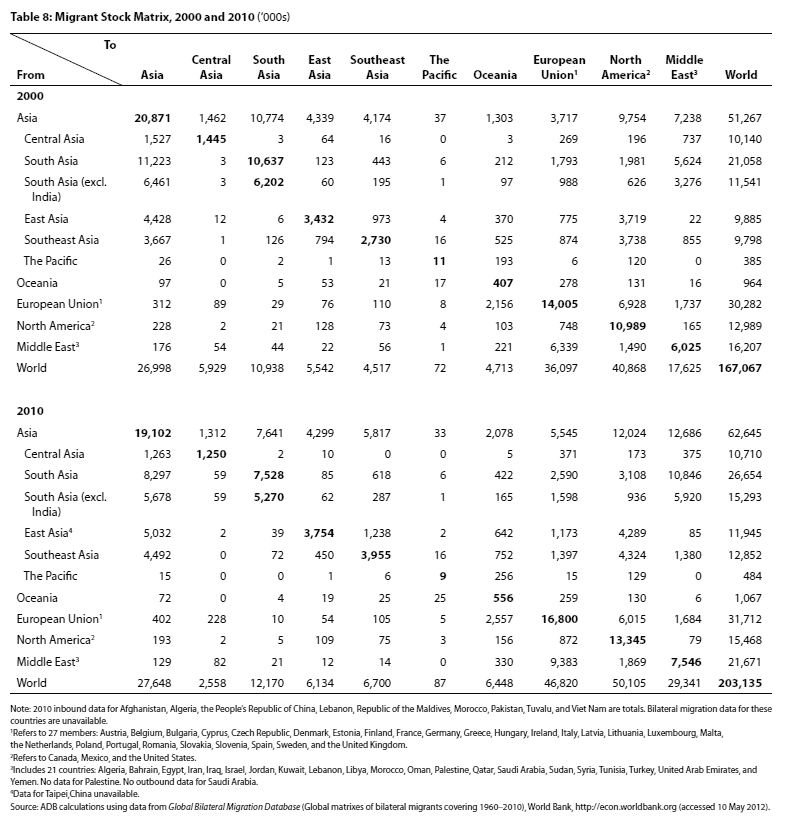
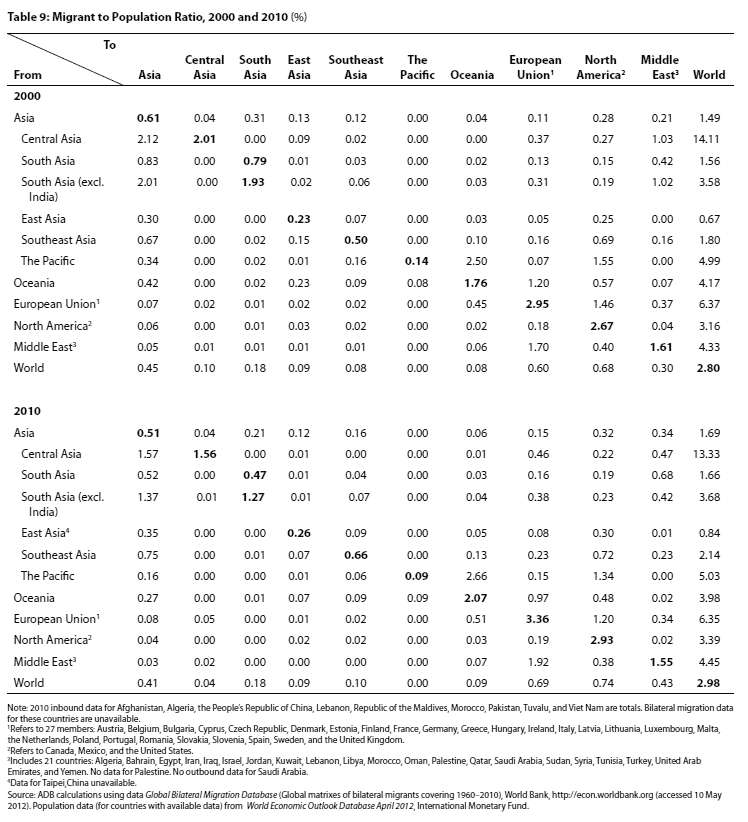
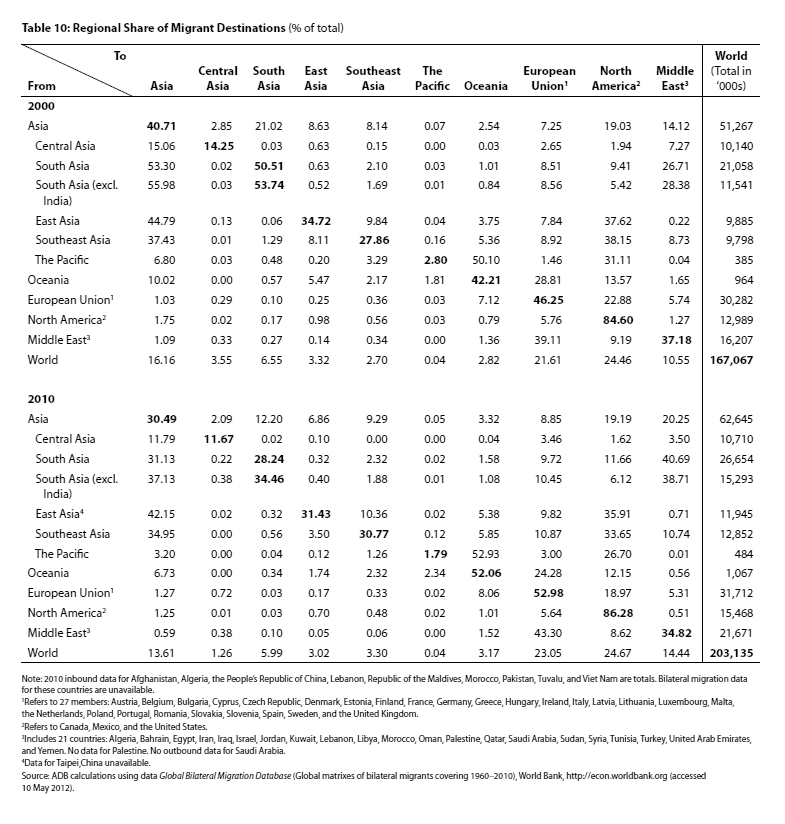
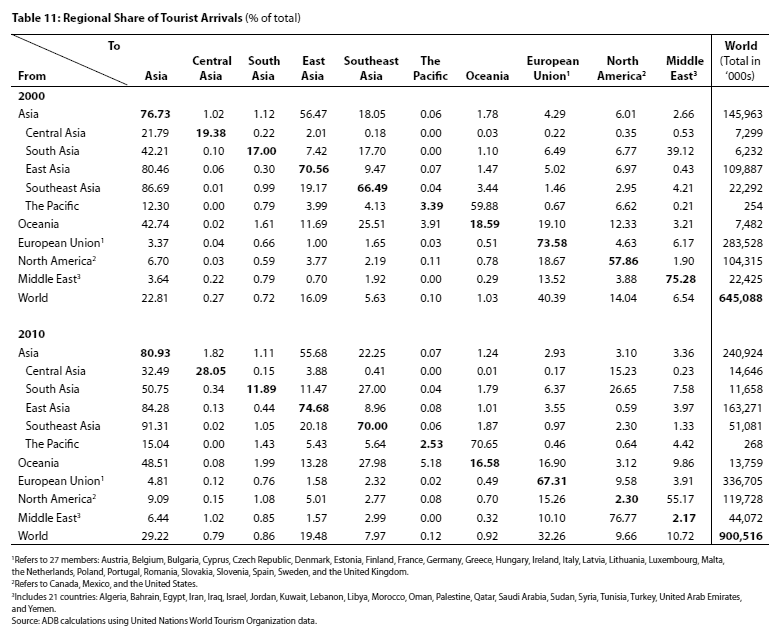
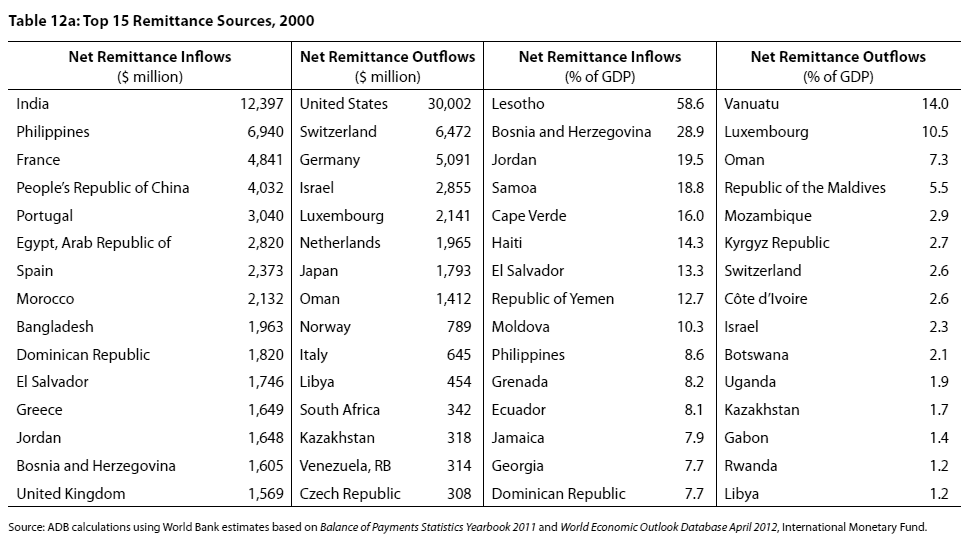
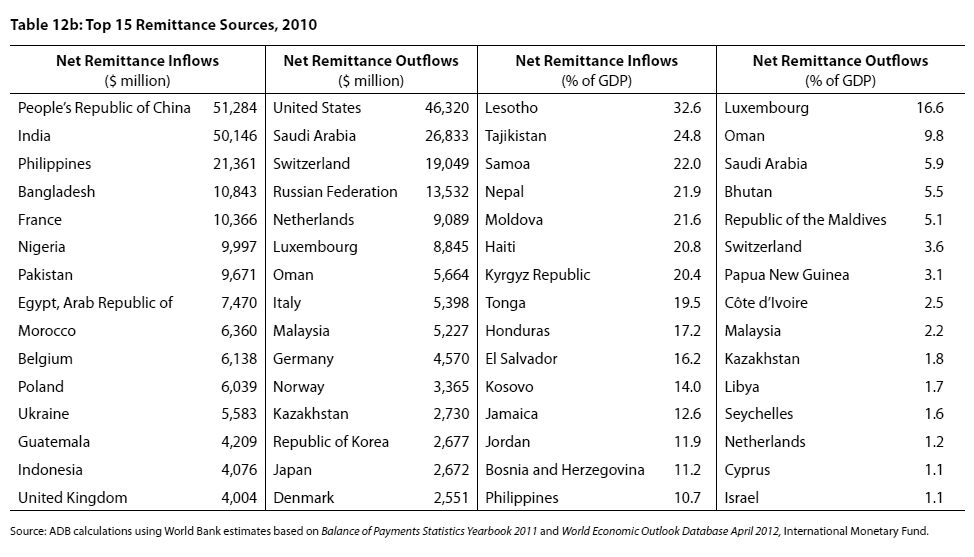
Charts Chart | Data Figure 39: Gross Remittance Inflows Tables Chart | Data Table 8: Migrant Stock Matrix, 2000 and 2010 Chart | Data Table 9: Migrant to Population Ratio, 2000 and 2010 Chart | Data Table 10: Regional Share of Migrant Destinations Chart | Data Table 11: Regional Share of Tourist Arrivals Chart | Data Table 12a: Top 15 Remittance Sources, 2000 Chart | Data Table 12b: Top 15 Remittance Sources, 2010 -
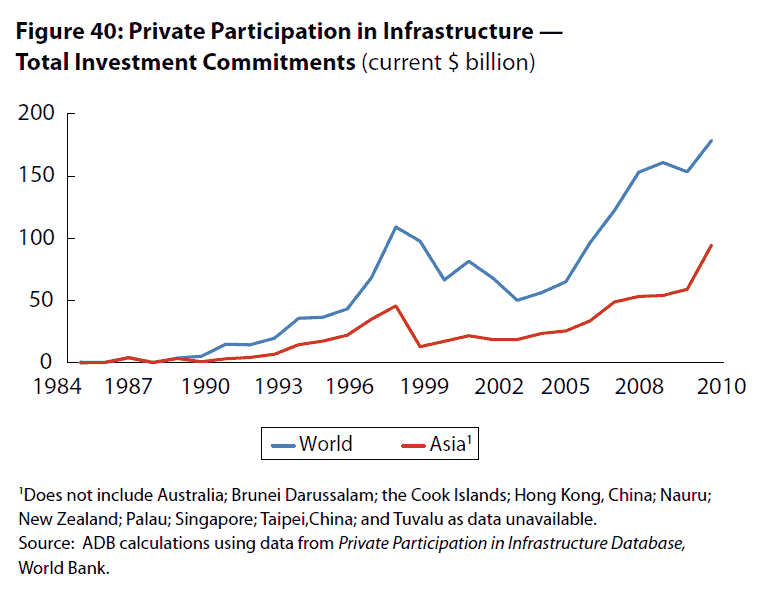
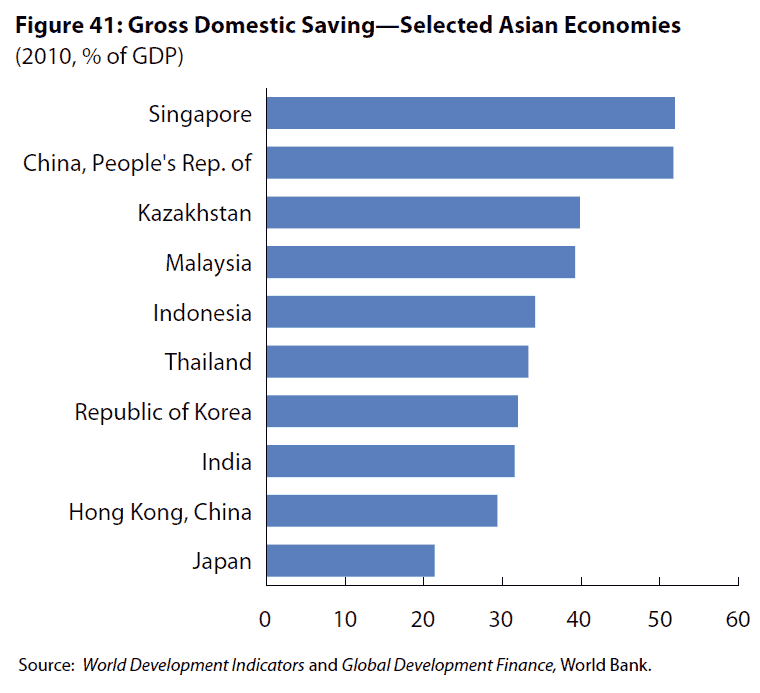
Infrastructure Connectivity
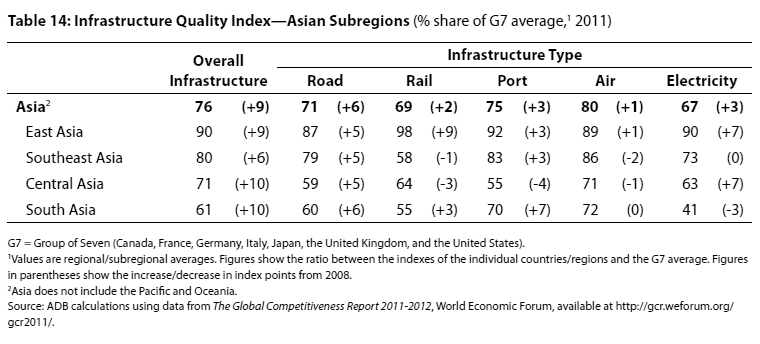
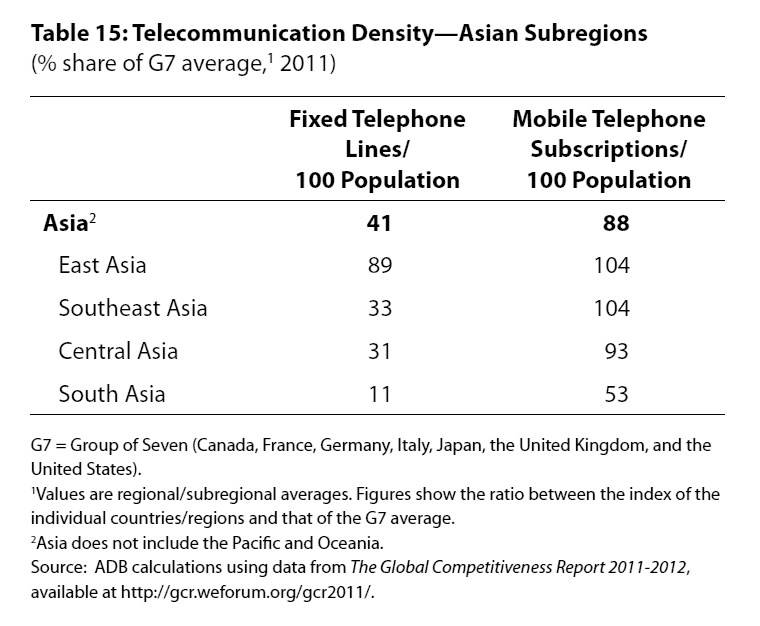
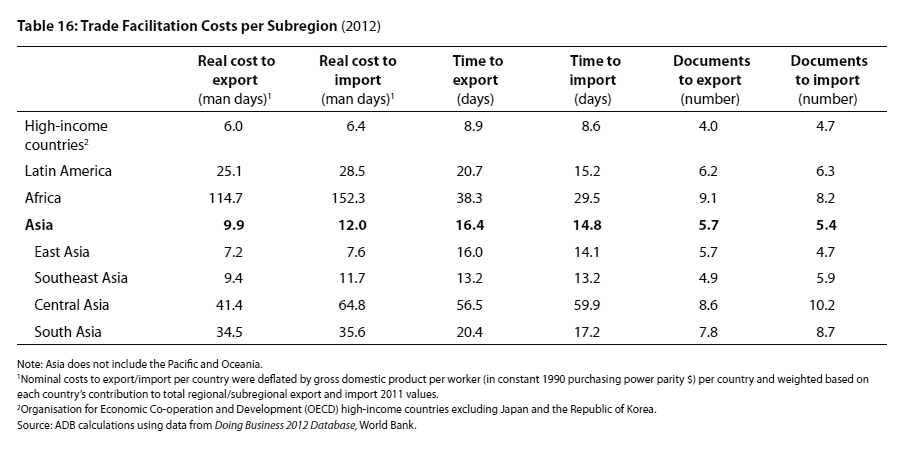
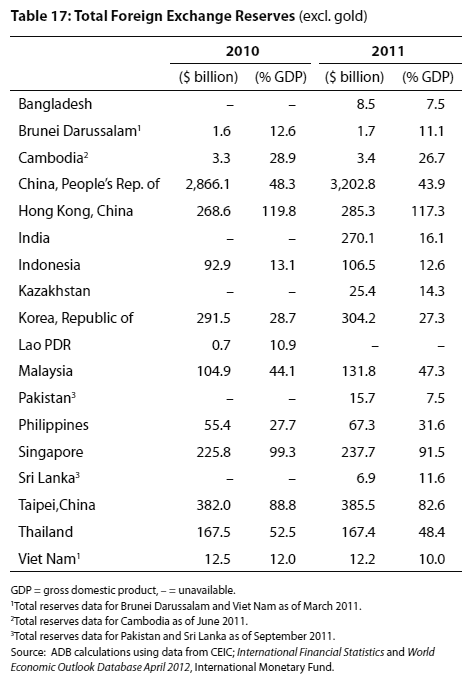
Charts Chart | Data Figure 40: Private Participation in Infrastructure — Total Investment Commitments Chart | Data Figure 41: Gross Domestic Saving—Selected Asian Economies Tables Chart | Data Table 13: Asia’s Infrastructure Requirements, 2010-2020 Chart | Data Table 14: Infrastructure Quality Index—Asian Subregions Chart | Data Table 15: Telecommunication Density—Asian Subregions Chart | Data Table 16: Trade Facilitation Costs per Subregion Chart | Data Table 17: Total Foreign Exchange Reserves -
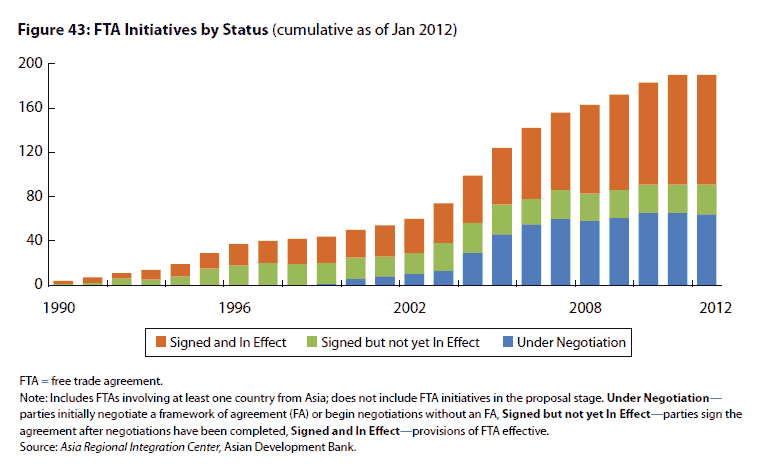
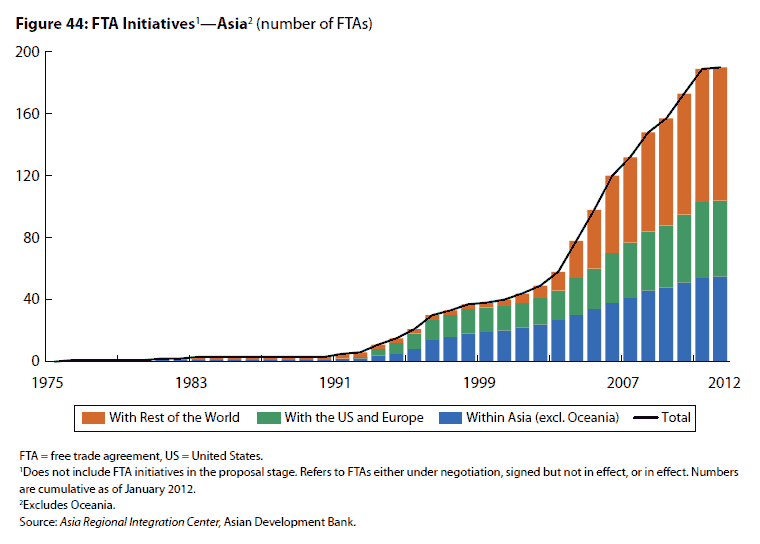
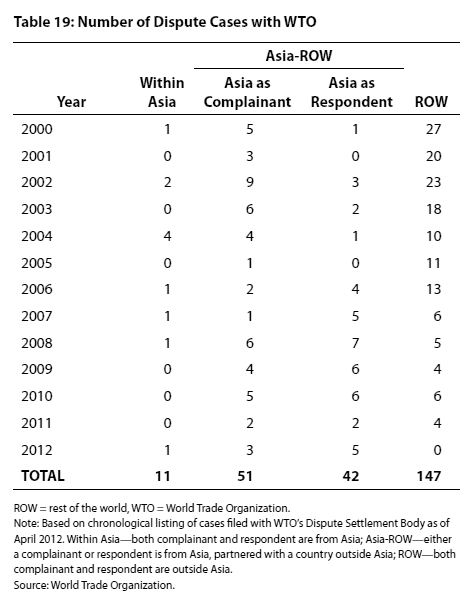
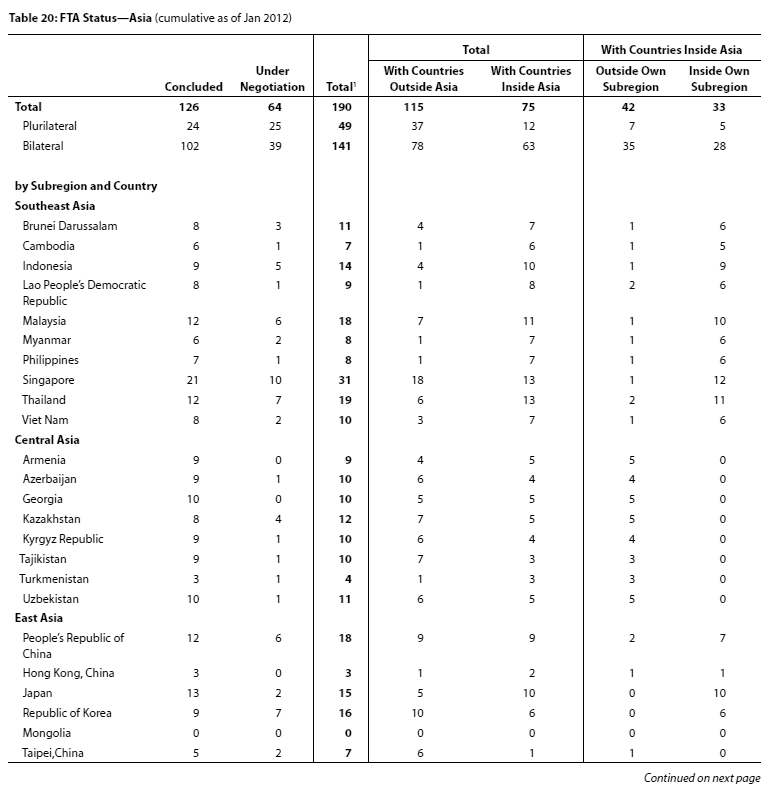
Cooperation in Trade Policy
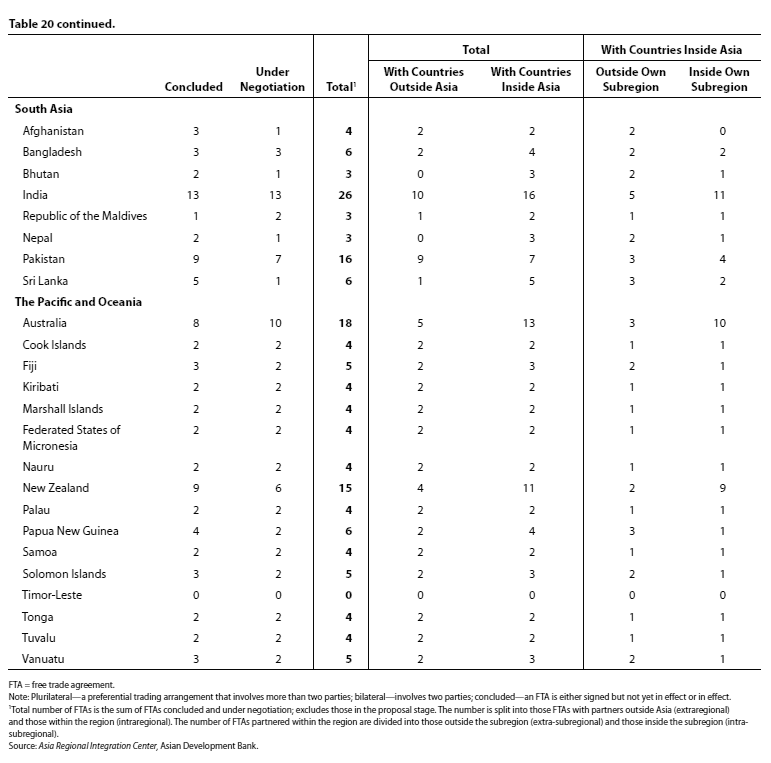
Charts Chart | Data Figure 42: MFN Tariff Trends—Asia Chart | Data Figure 43: FTA Initiatives by Status Chart | Data Figure 44: FTA Initiatives—Asia Tables Chart | Data Table 18: Number of Anti-Dumping Dispute Cases with WTO Chart | Data Table 19: Number of Dispute Cases with WTO Chart | Data Table 20: FTA Status—Asia (part 1) Chart | Data Table 20: FTA Status—Asia (part 2) -
Macroeconomic and Financial Cooperation
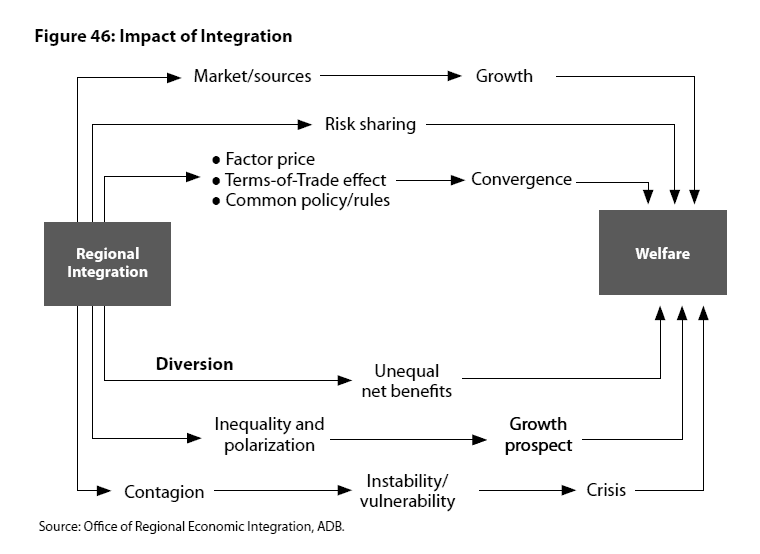
Special Section—Regional Integration: A Balanced View
| Charts | |
| Chart | Data | Figure 46: Impact of Integration |
Complete Report
Related links
- Regional Cooperation in a Highly Interconnected World A Seminar on Regional Cooperation and Integration in Asia and the Pacific
- News release: National and Regional Actions Required to Realize Growth Benefits of Integration
- Video: Economic Volatility Spurs Asia to Greater Cooperation
- Infographic: Trade in Asia: 2008-2012
- RCI Round Table: Regional Cooperation in a Changing Global Economic Landscape
- In Search of Free Trade in Asia - ADB Live Online Chat
- News release
- Video: ADB: Despite Eurozone Economic Crisis, Integration Across Asia Will Increase