RCI
INFORMATION
PACK
JANUARY 2014 • ISSUE NO. 8
At a Glance:
SPECIAL FEATURE:
 FULL REPORT
 RCI NEWS AND EVENTS
MONETARY, FINANCIAL AND TRADE INDICATORS
RCI NEWS AND EVENTS
MONETARY, FINANCIAL AND TRADE INDICATORS
 SPECIAL FEATURE:
Early weakness in 2014?
RCI News and Events
- ASEAN Infrastructure Fund Ltd. begins operations; IFC offers new fund for long-term investments.
- World trade ministers approve “Bali Package”.
- Asian stock exchanges boost cooperation.
- Transport ministers reaffirm commitment to Asian transport development plan.
- More GMS projects included under new Regional Investment Framework; new Thai–Lao PDR bridge fills ‘missing link’ in North-South corridor.
- ADB inaugurates SASEC connectivity project in Bangladesh; administers infrastructure and livelihood projects in rural Myanmar.
- TPP negotiations continue; several other trade agreements advance.
- Japan signs currency swaps with central banks; India’s central bank extends financial cooperation with other countries. Warsaw Climate Change Conference paves way to set targets on reducing gas emissions.
- ADB offers rehabilitation assistance after super typhoon Haiyan devastates central Philippines.
Monetary, Financial, and Trade Indicators
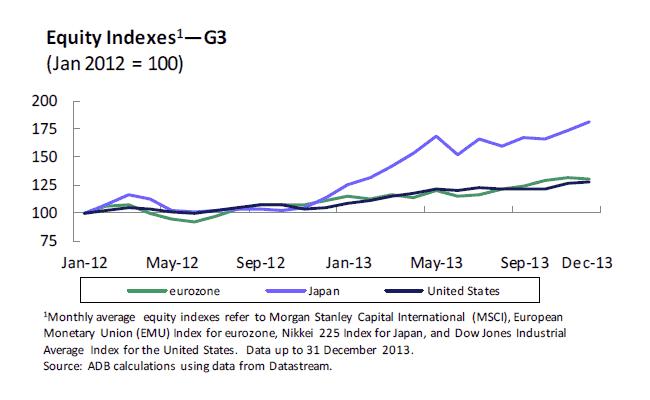
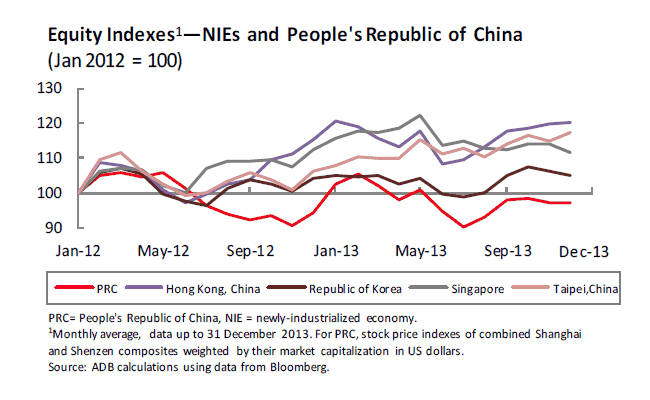
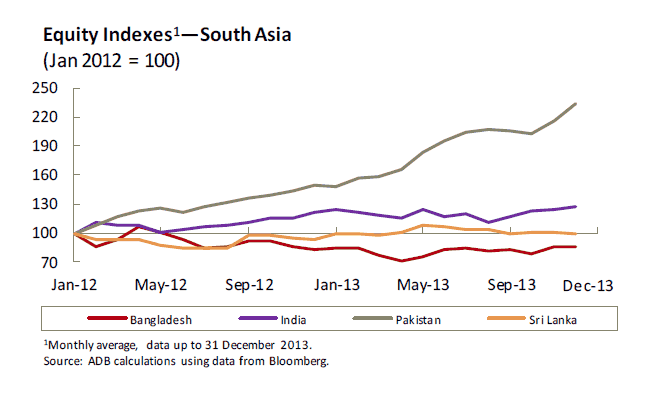
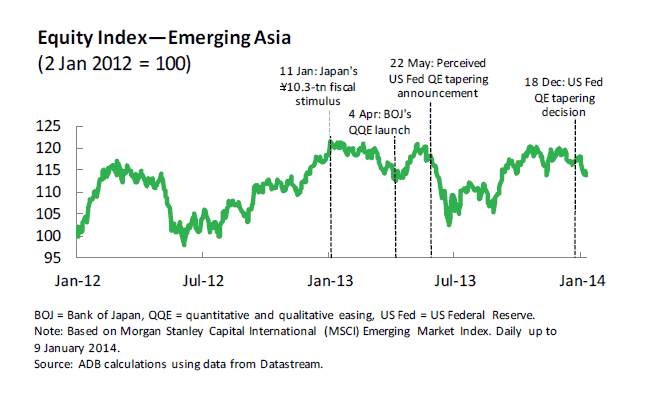
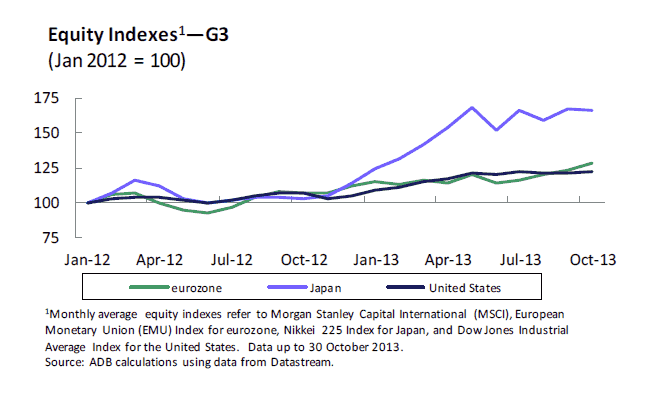
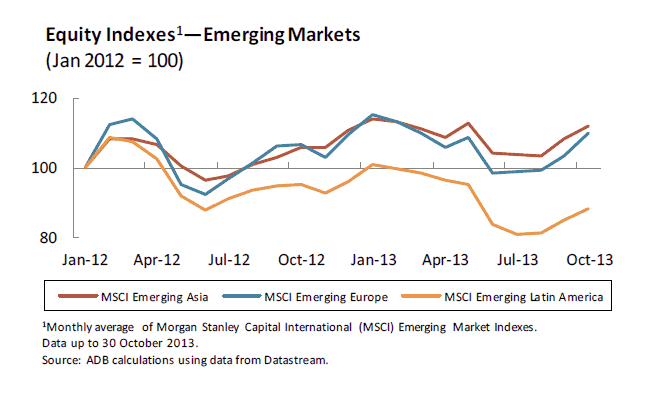
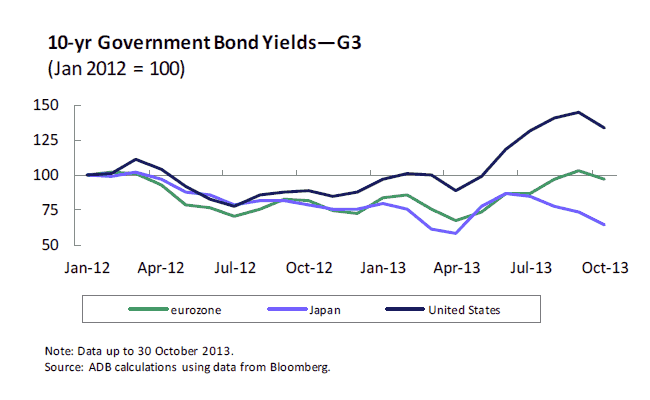
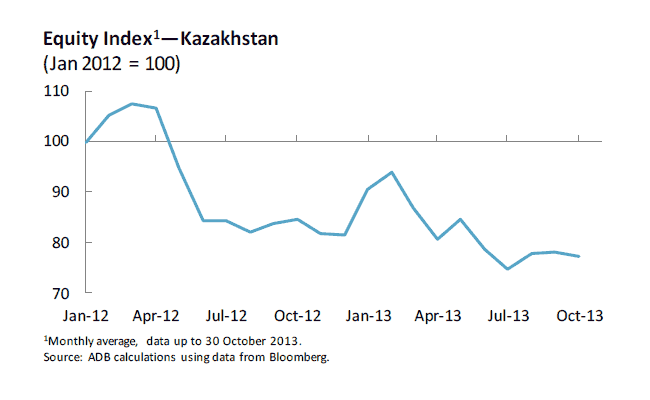
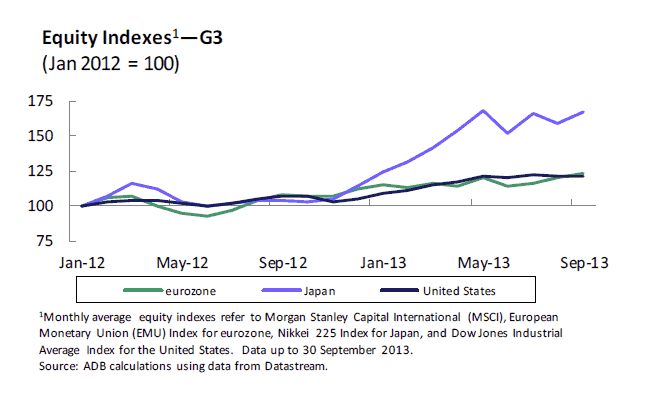
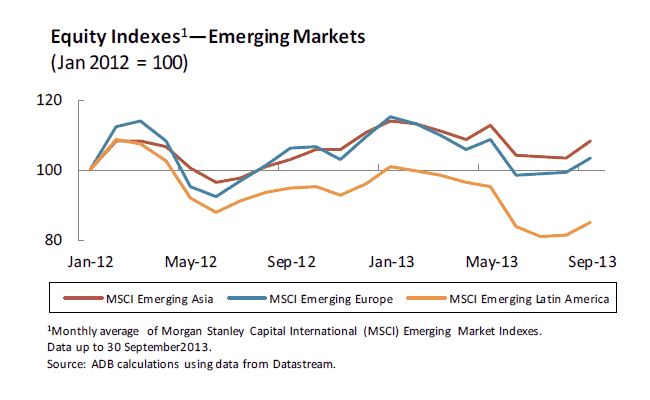
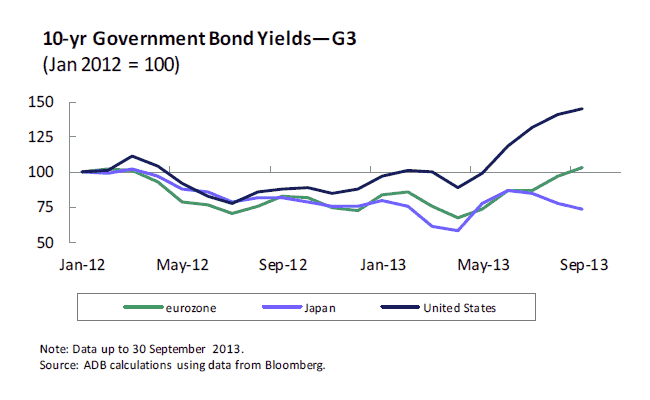
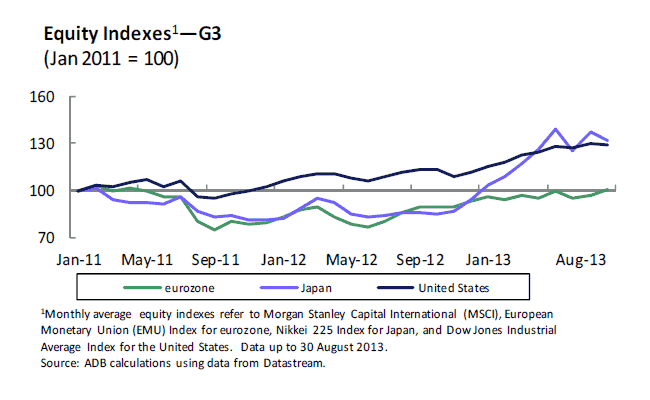
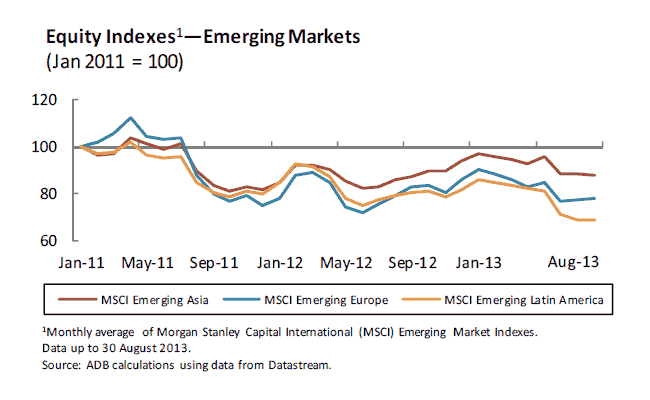
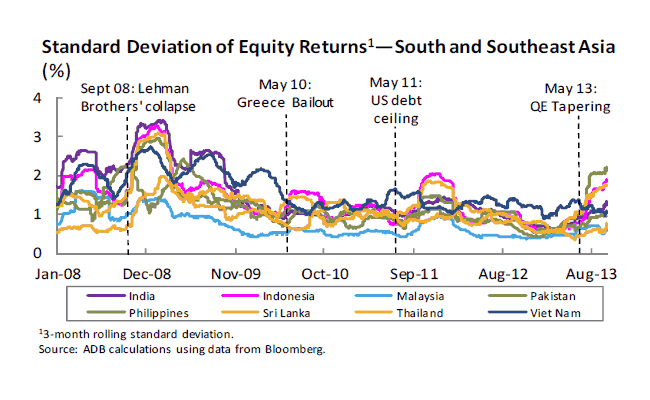
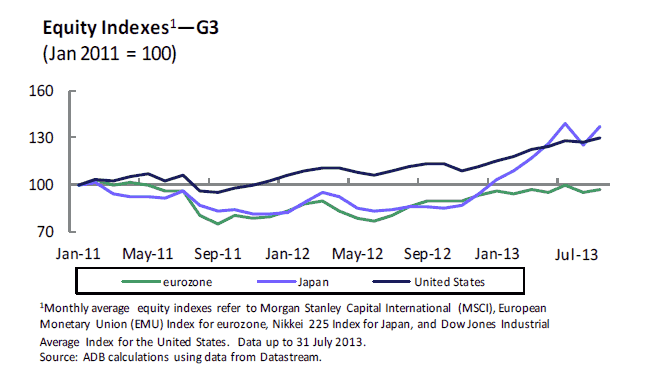
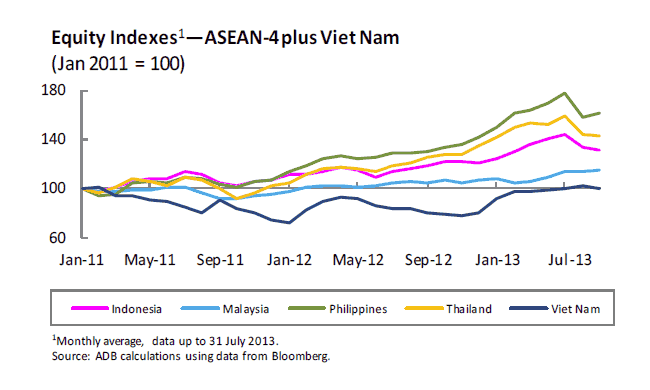
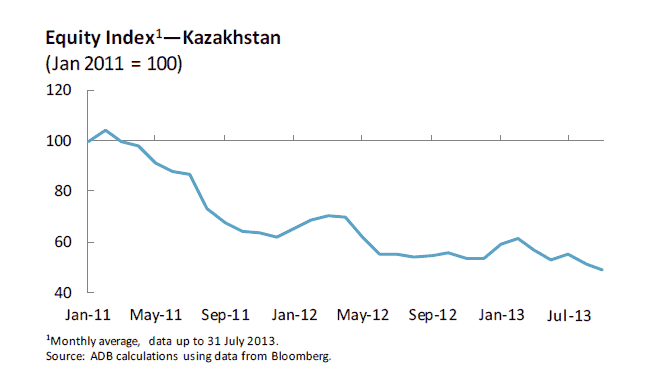
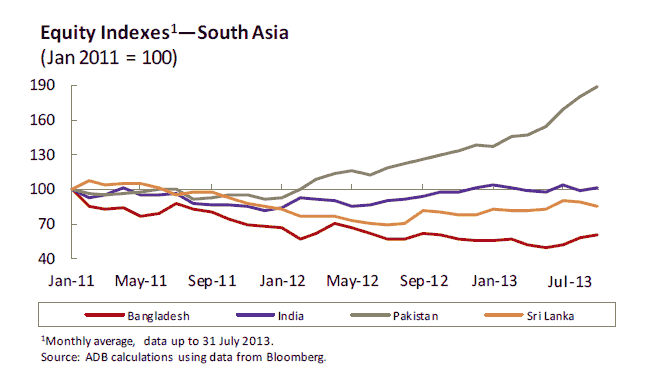
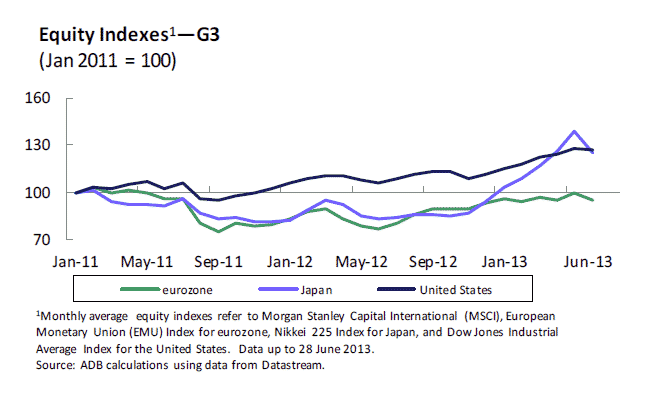
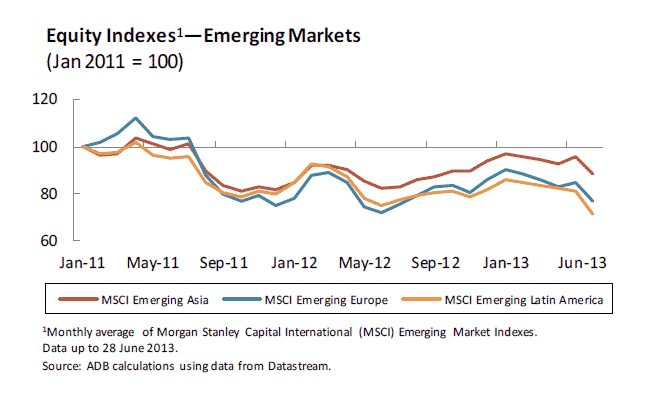
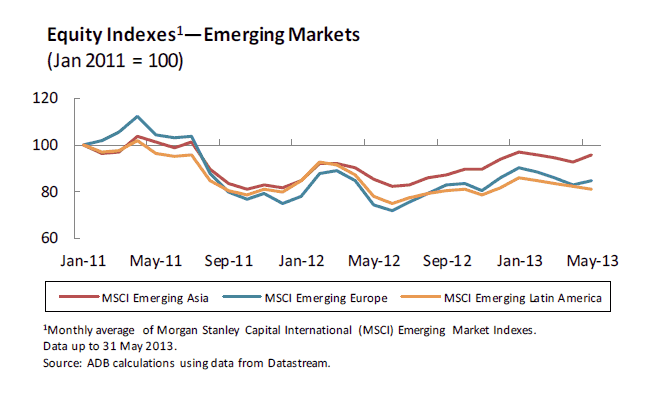
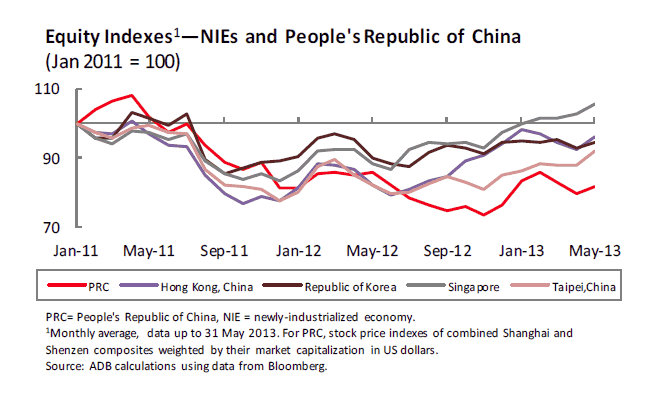
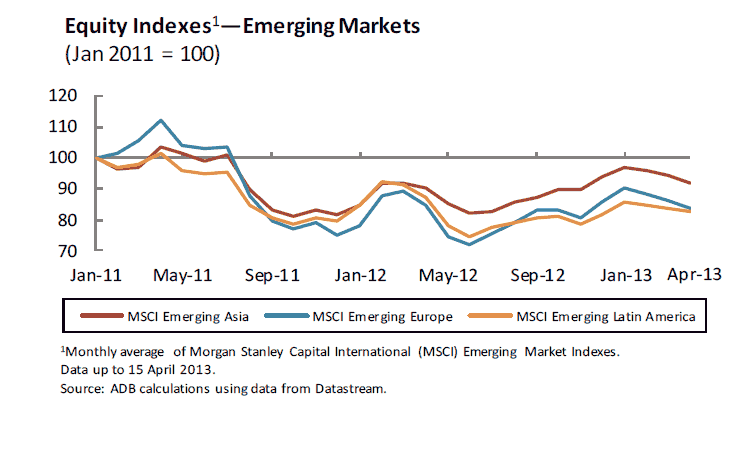
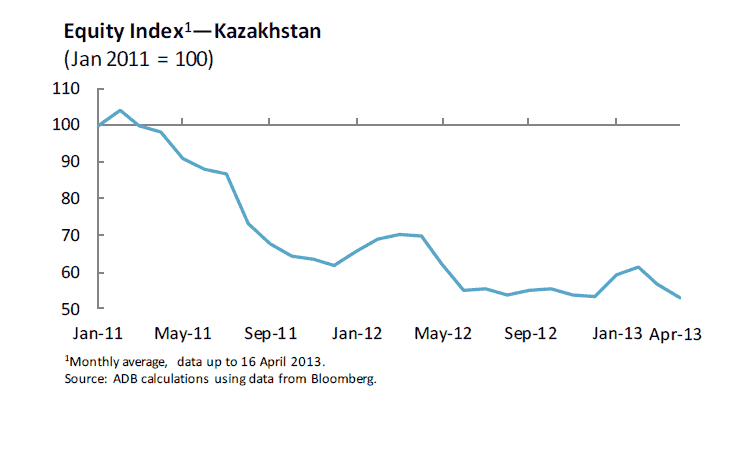
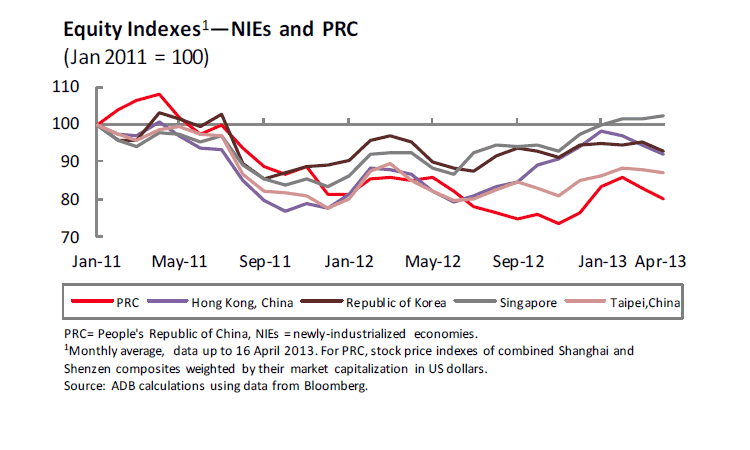
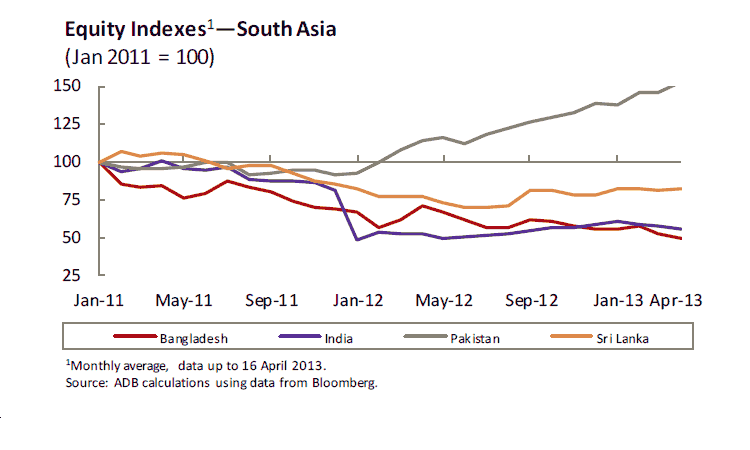
- G3 equities advance; emerging markets decline.
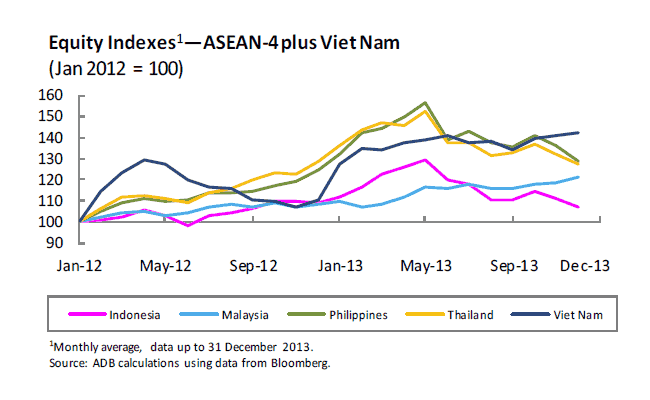
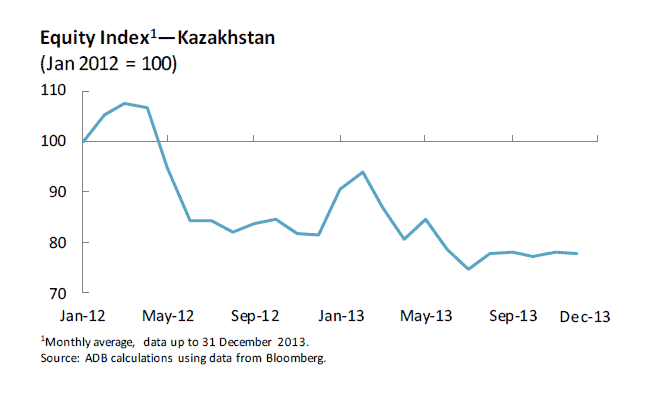
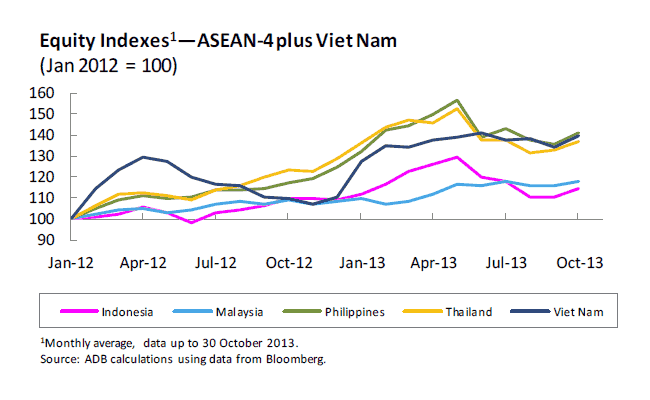
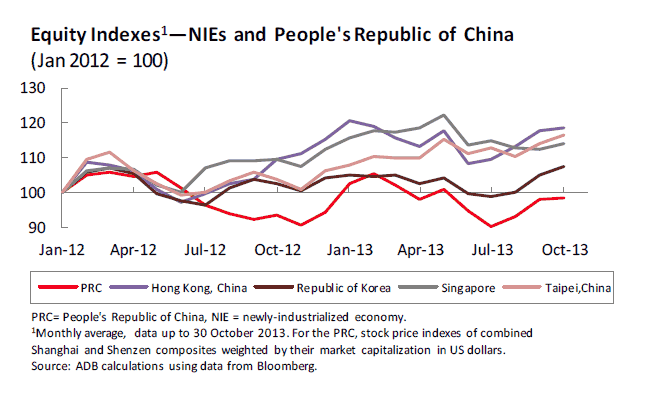
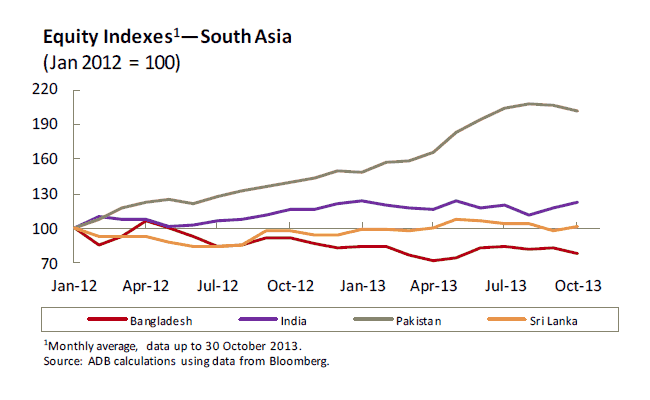
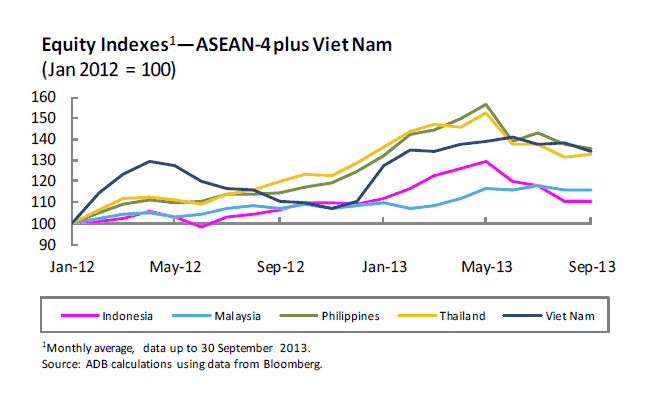
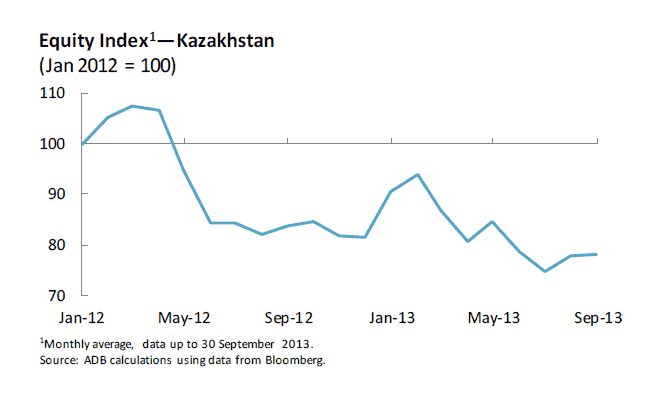
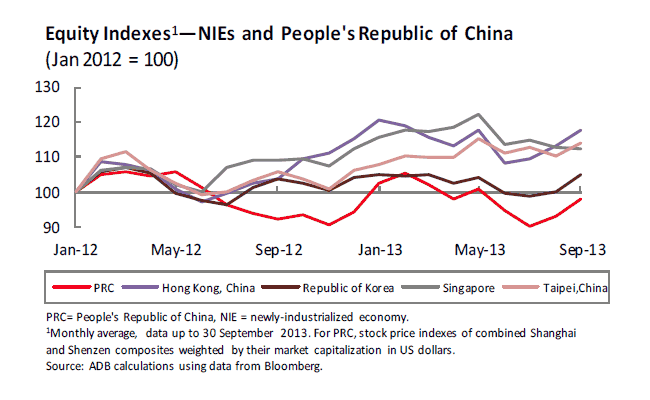
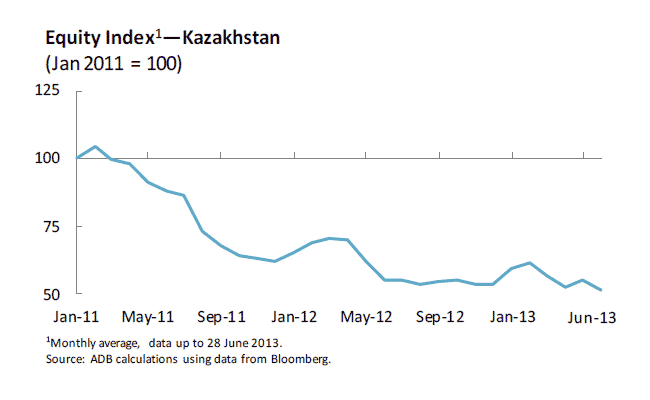
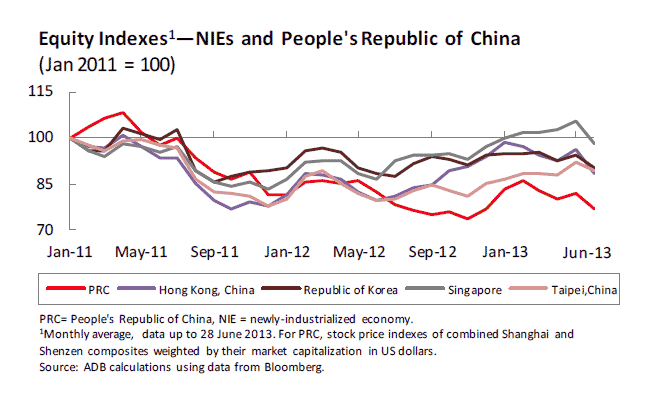
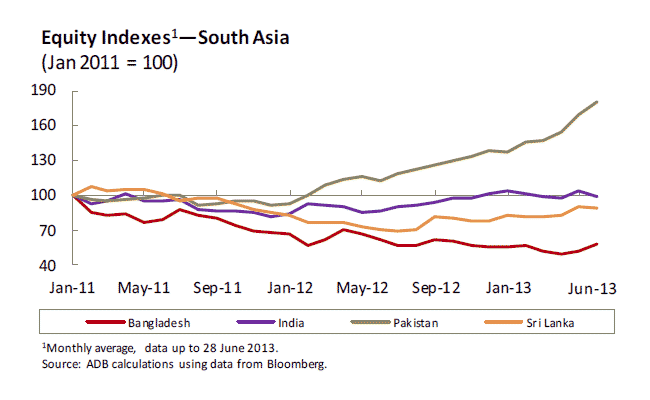
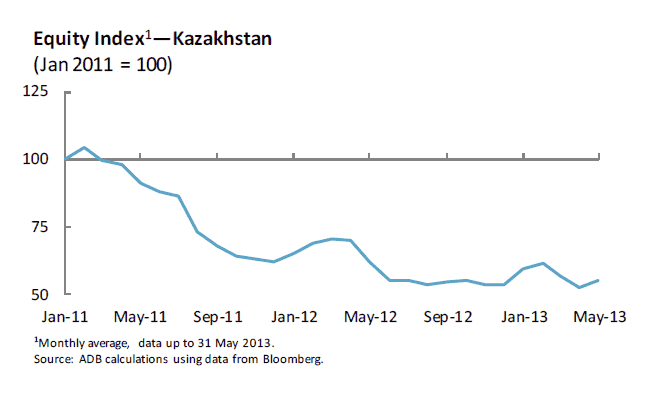
- Asian equities fall more on domestic conditions than US QE tapering.
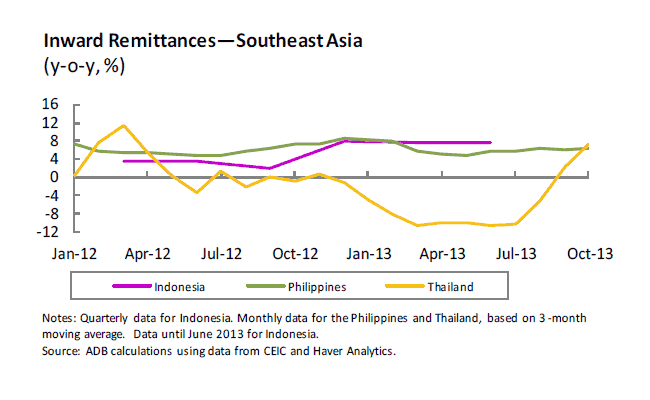
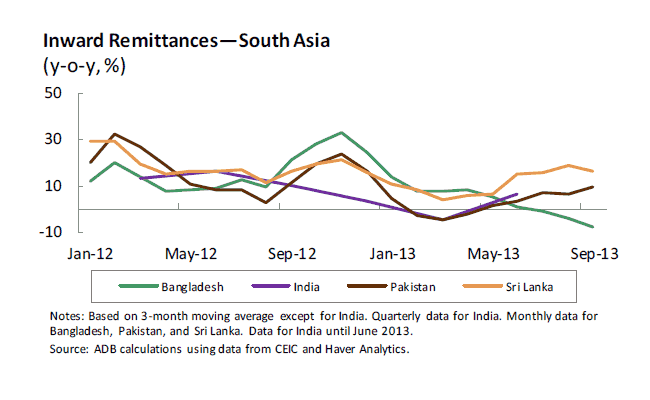
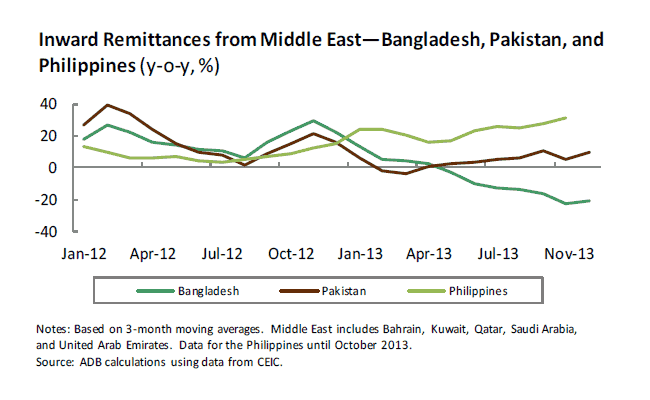
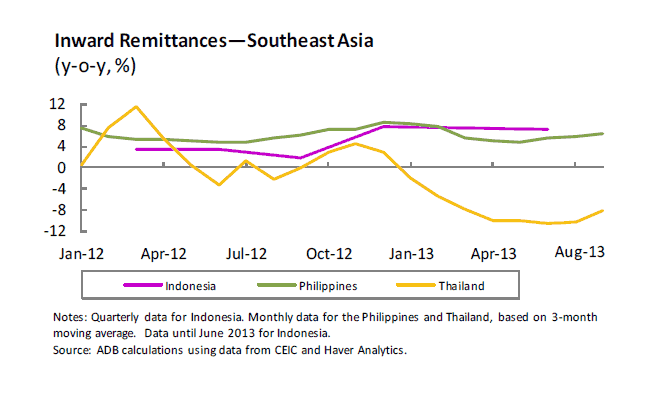
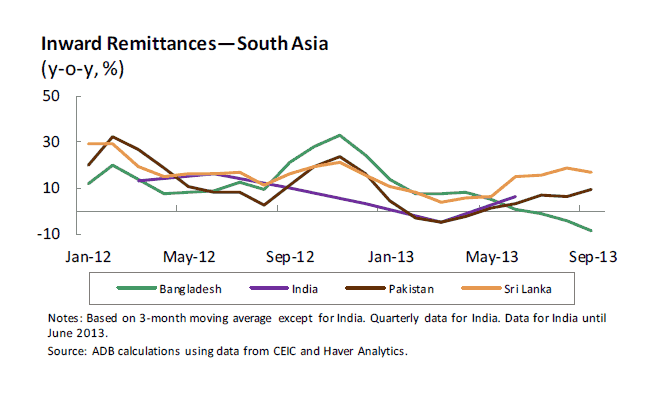
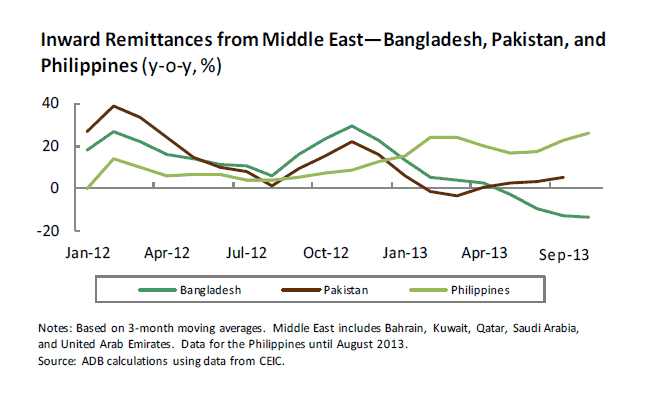
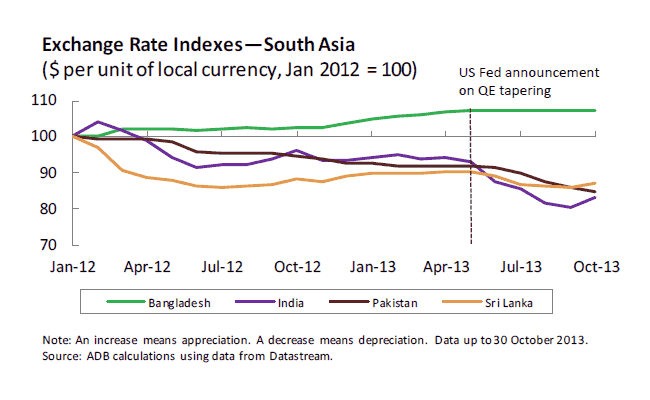
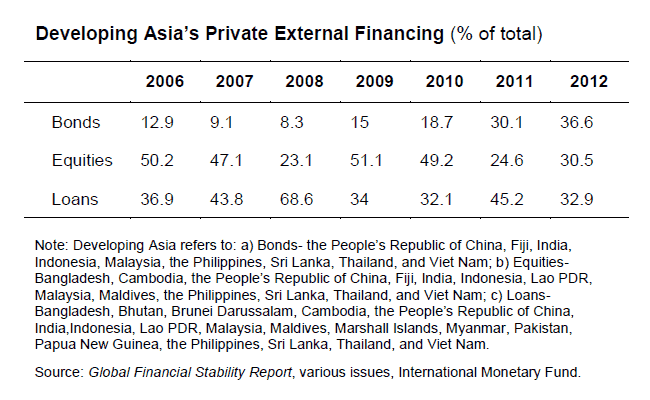
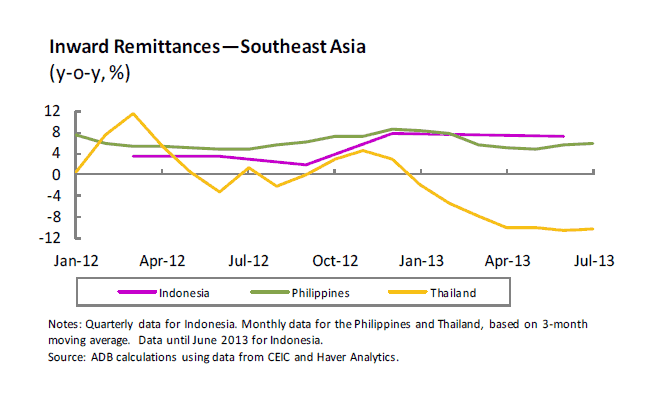
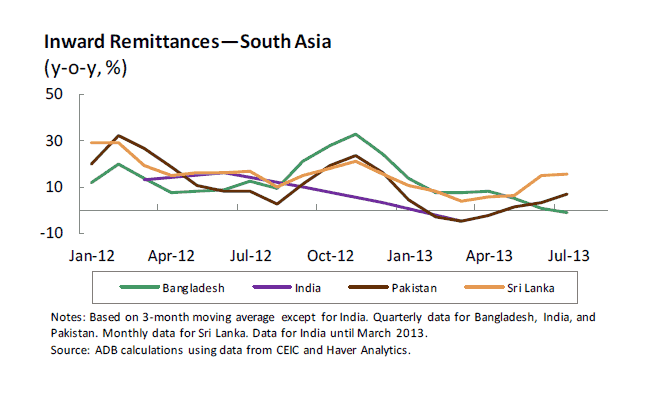
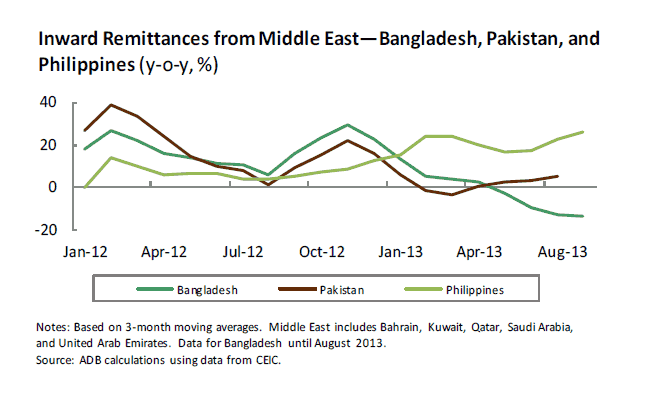
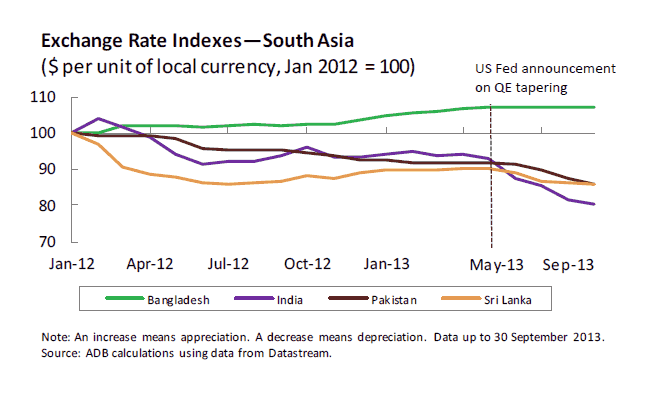
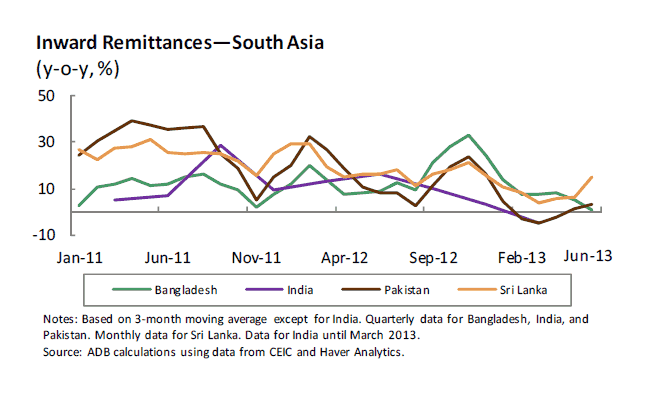
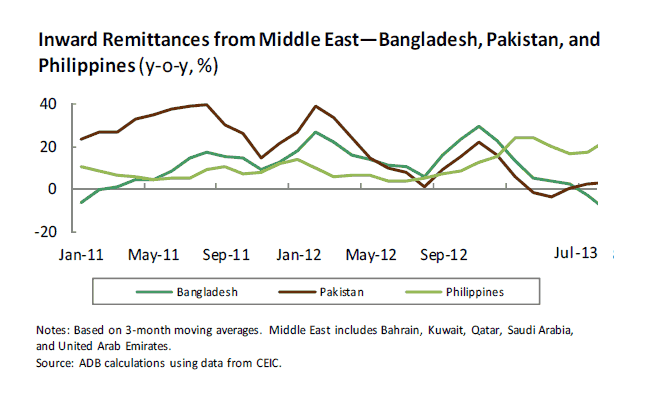
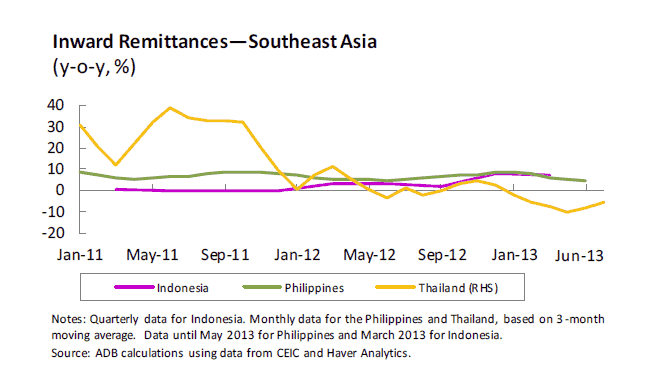
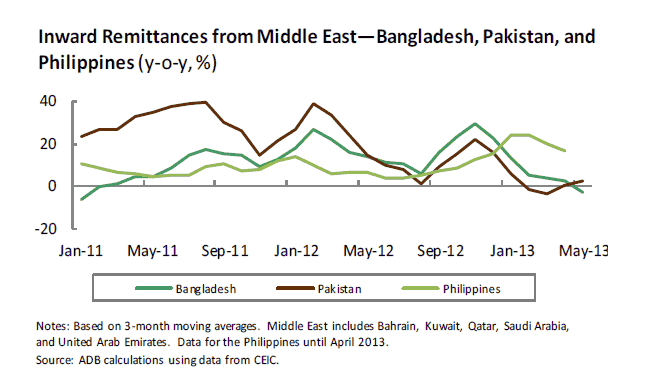
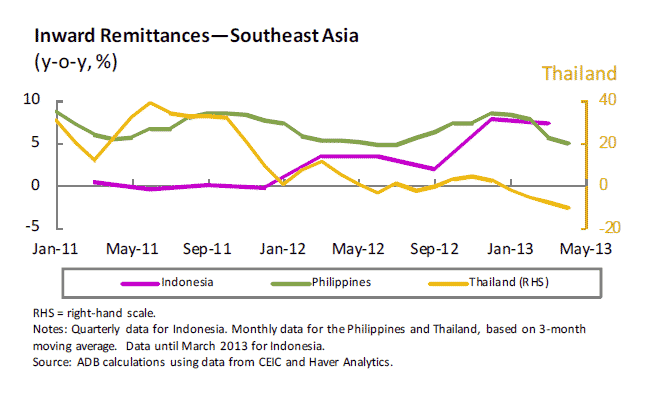
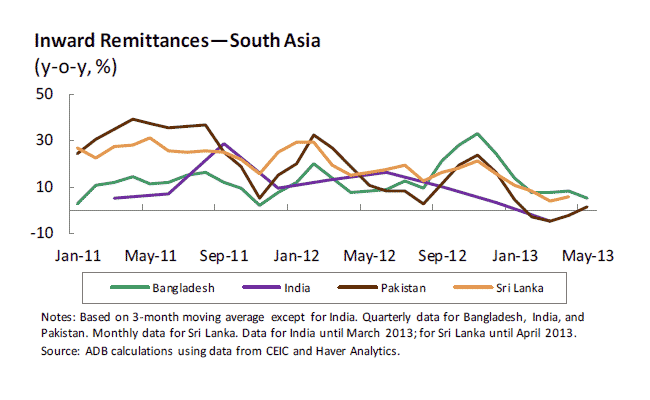
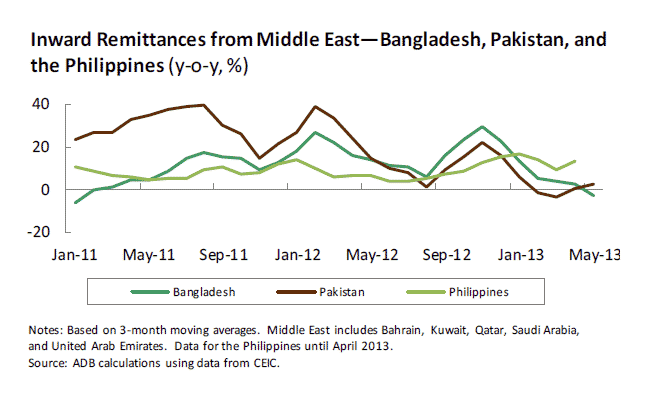
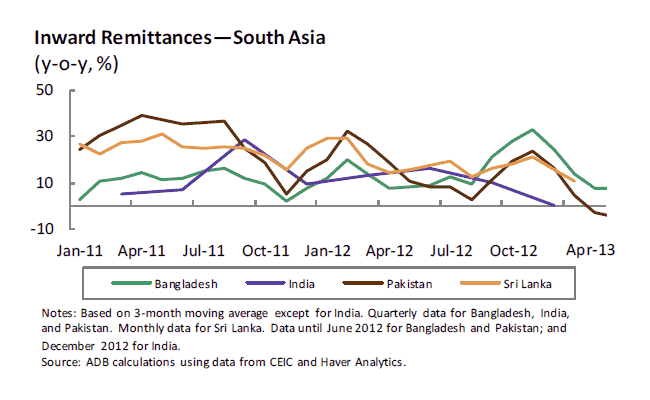
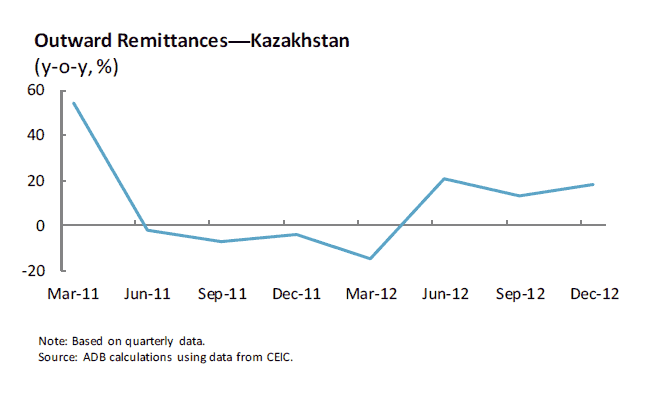
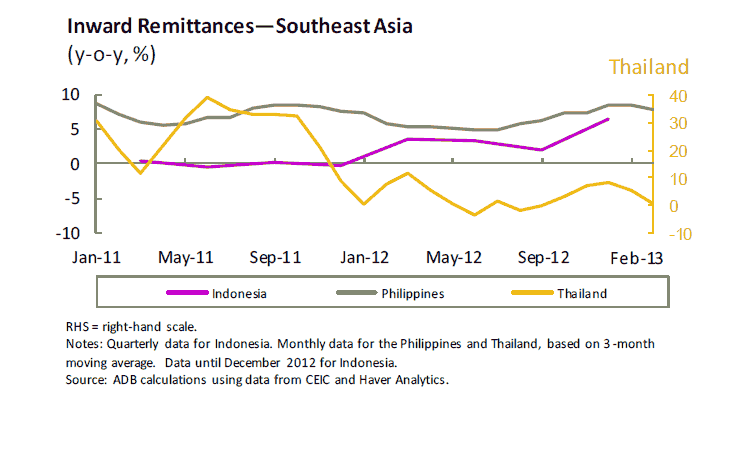
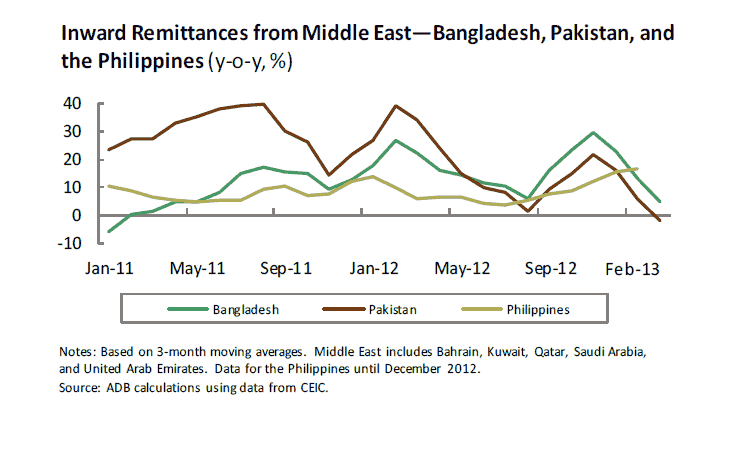
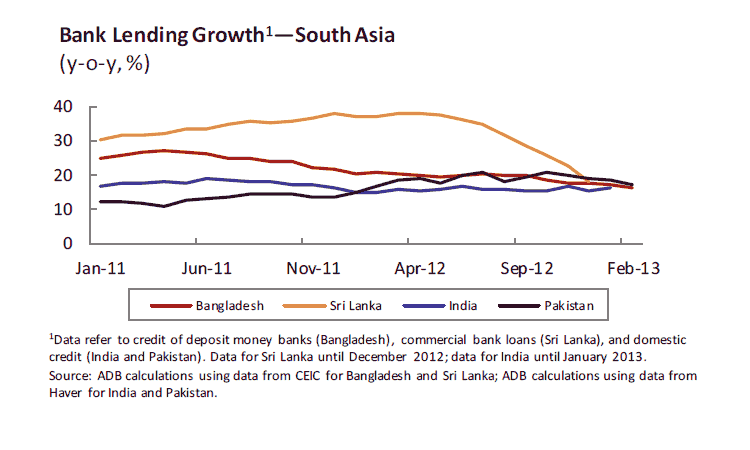
- Remittances to Bangladesh continue to decline.
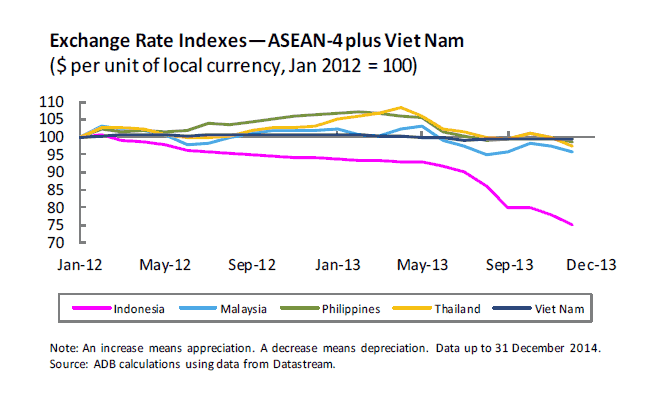
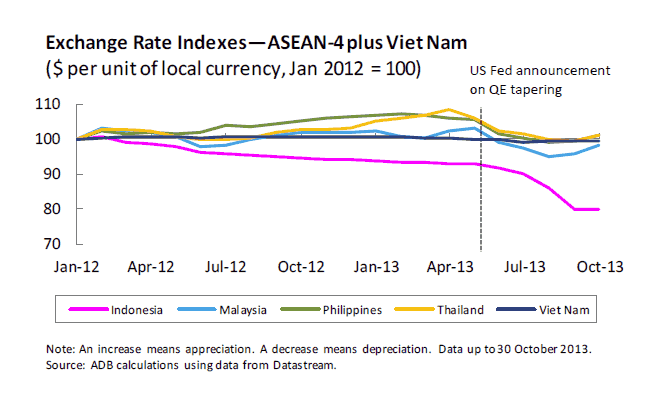
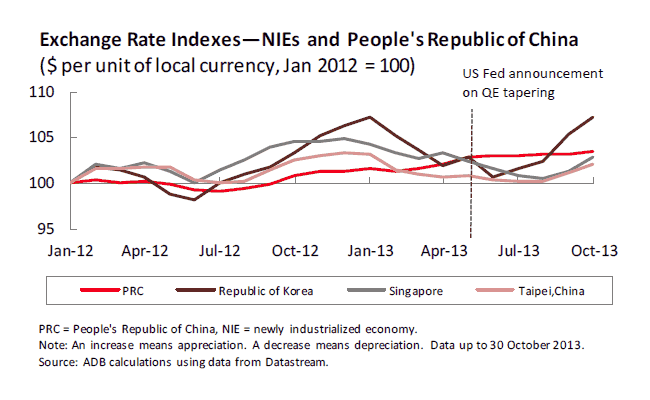
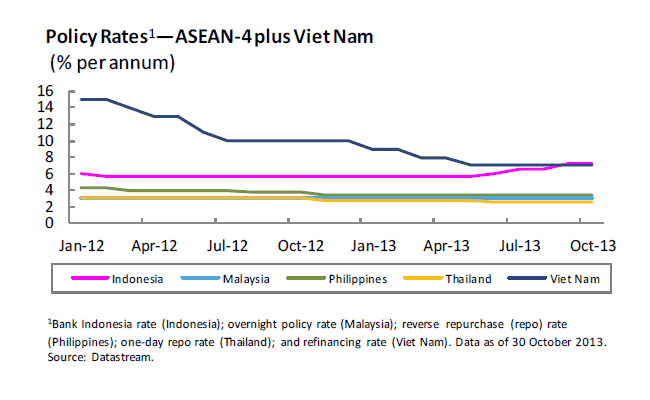
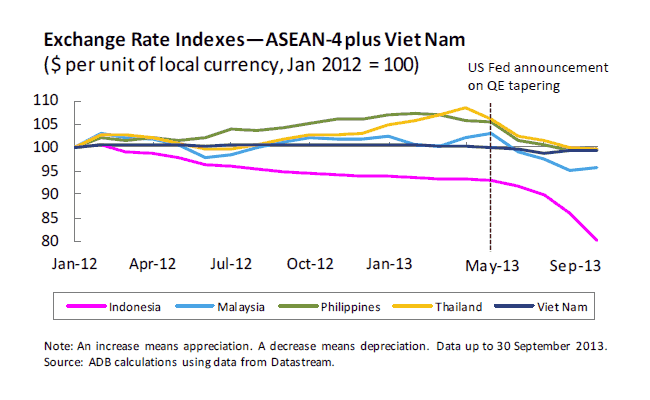
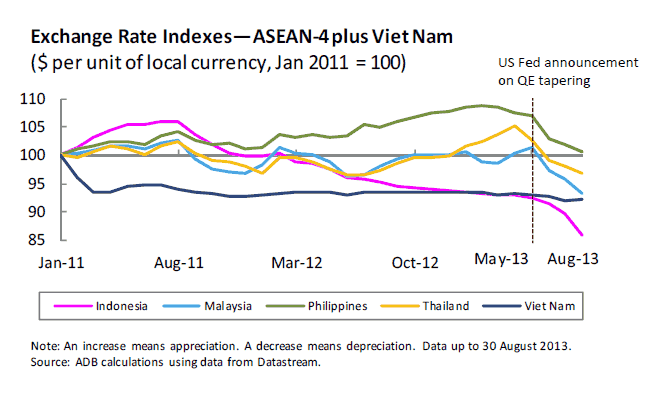
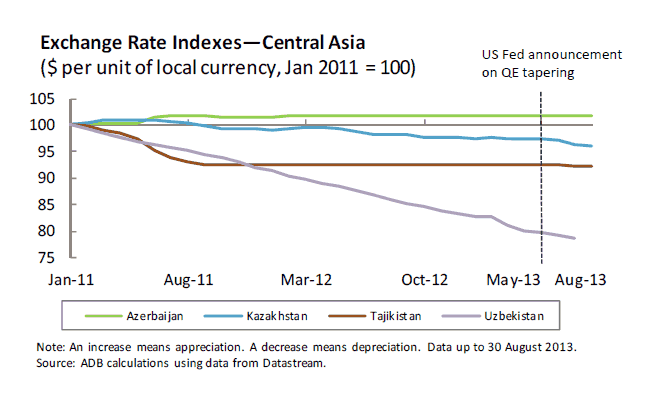
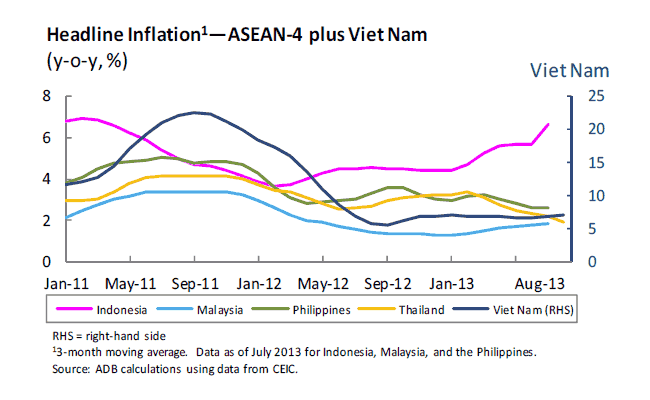
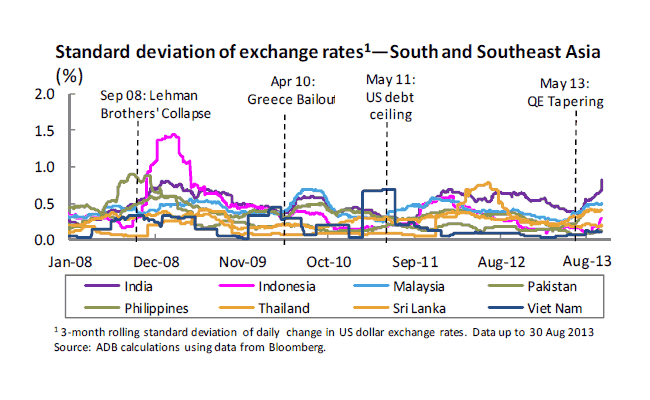
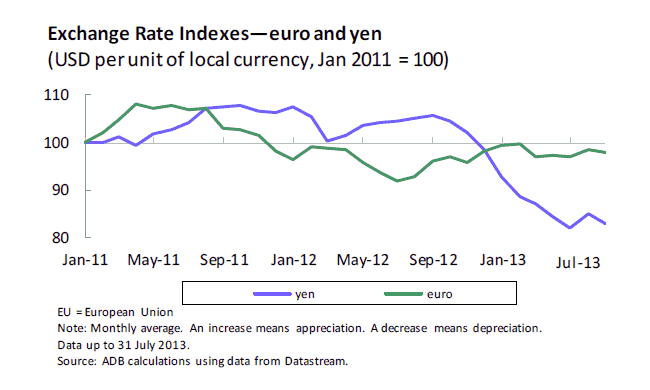
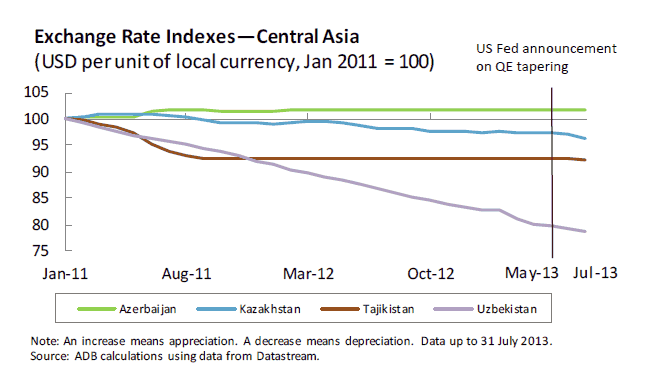
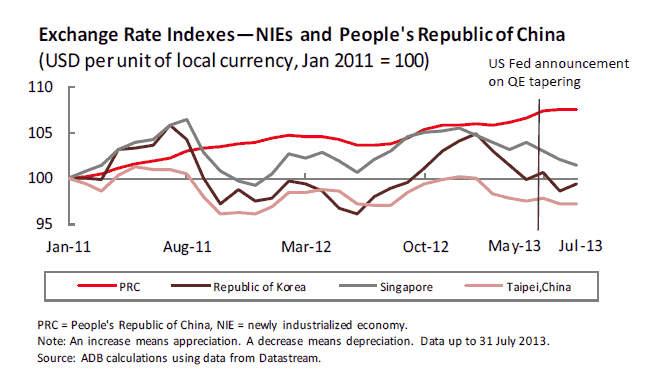
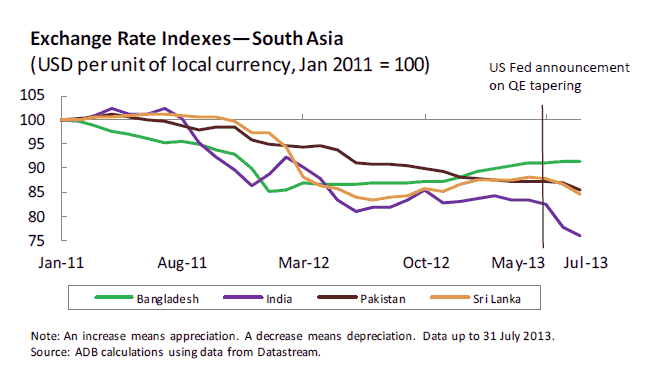
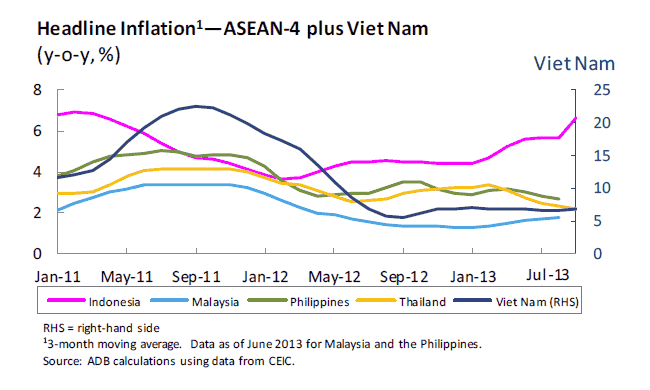
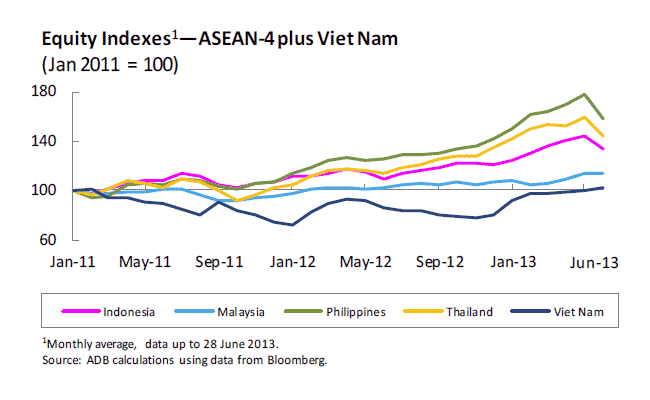
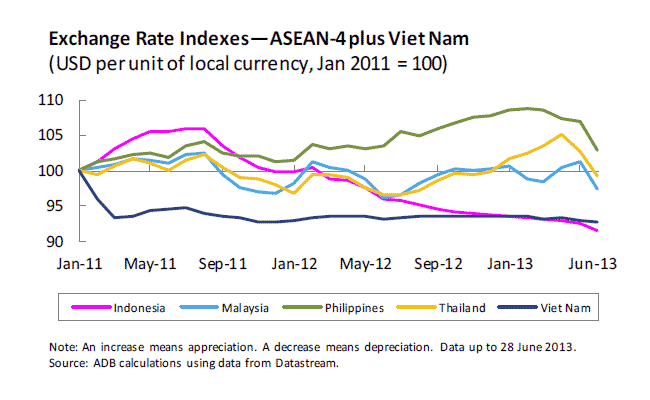
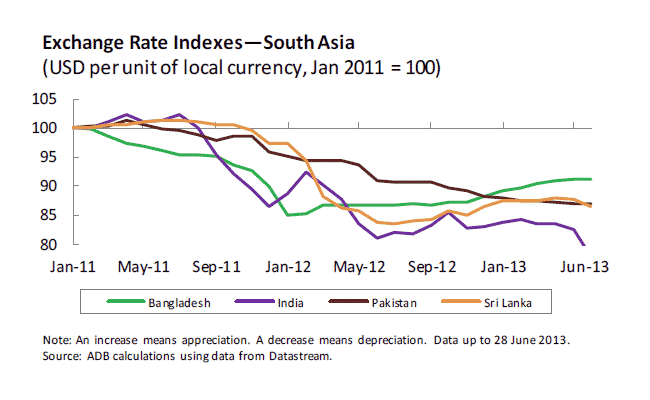
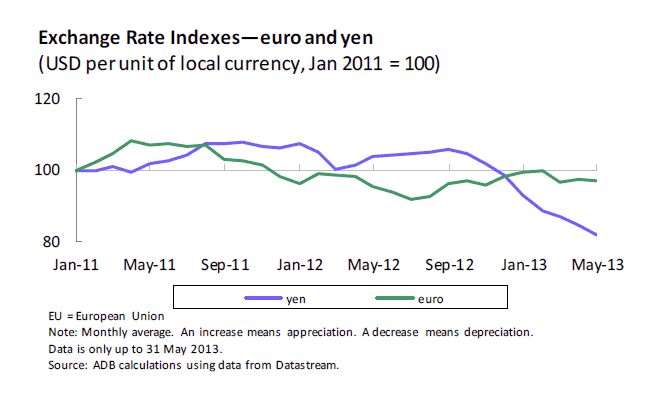
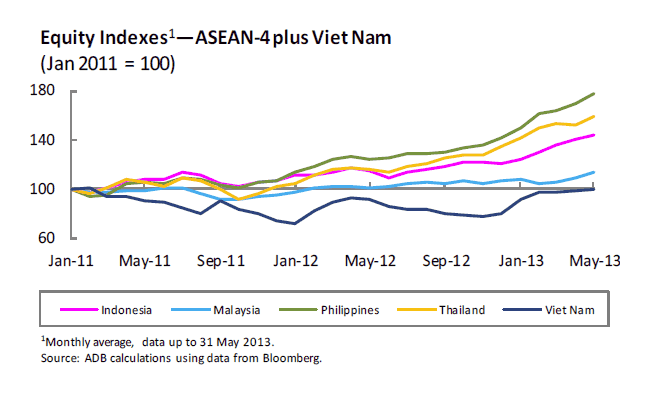
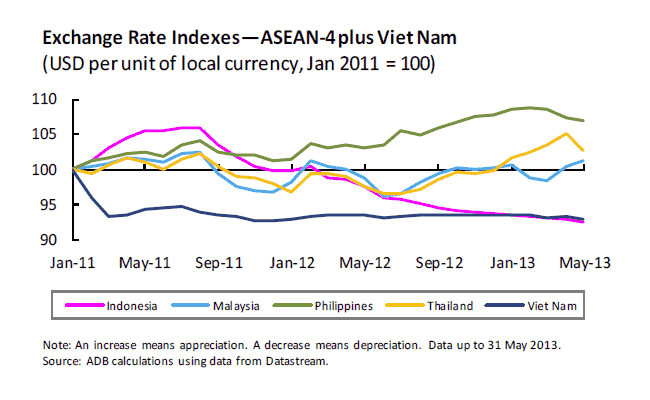
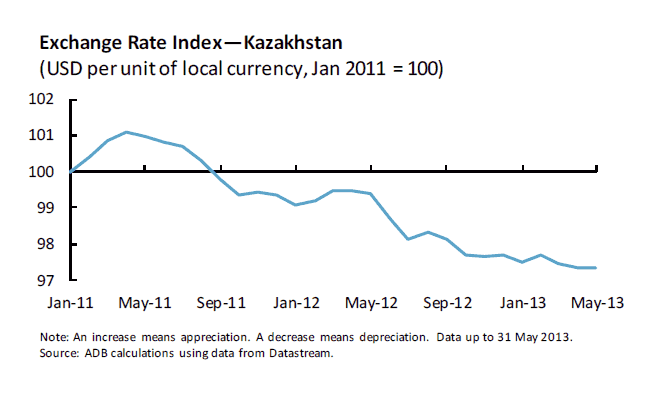
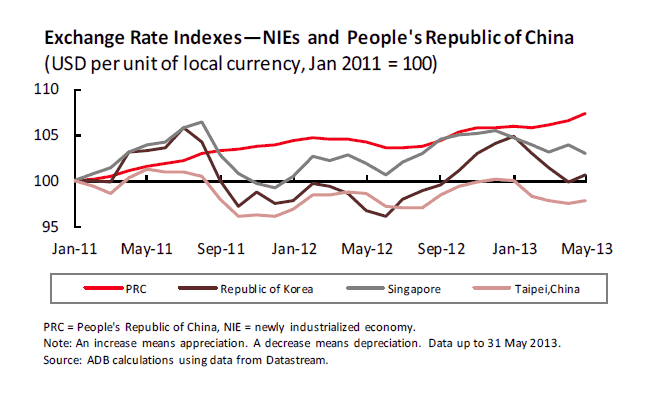
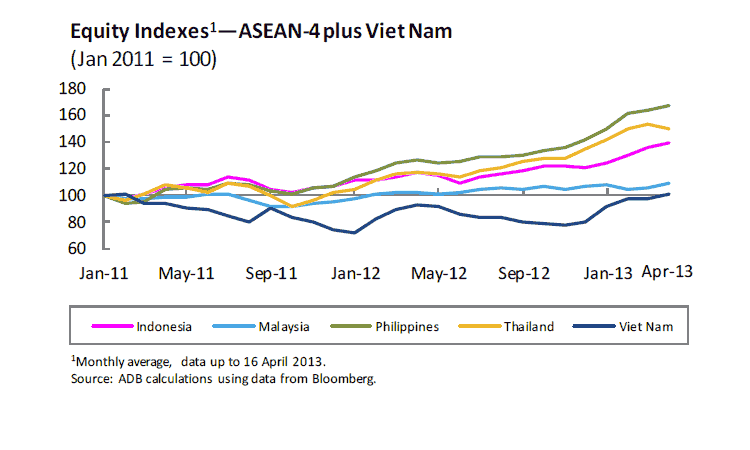
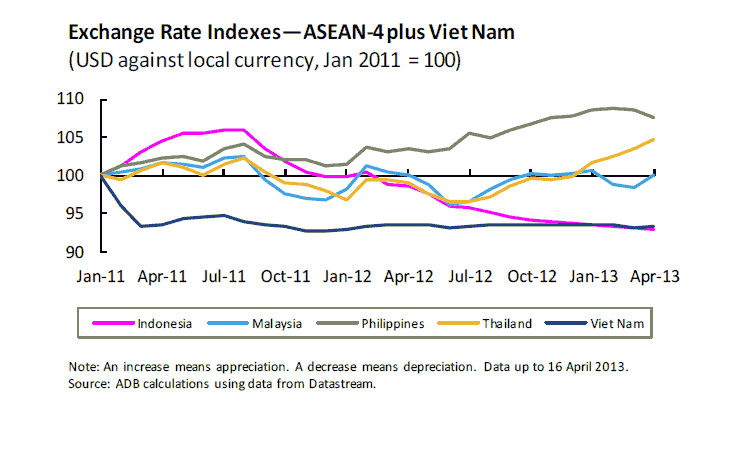
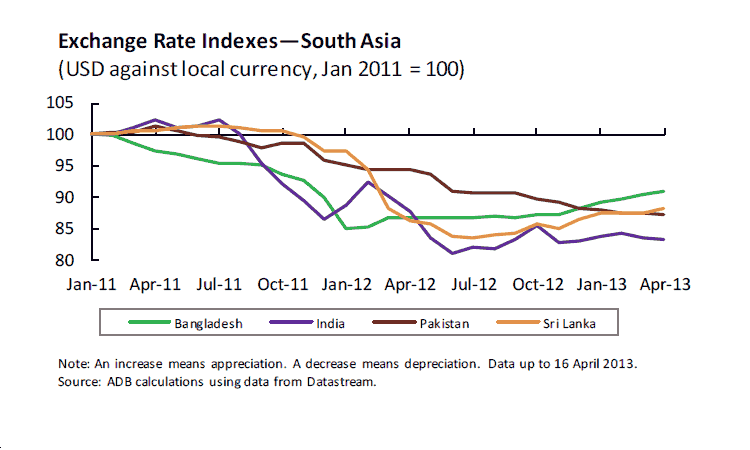
- ASEAN-4 plus Viet Nam currencies depreciate following QE tapering announcement.
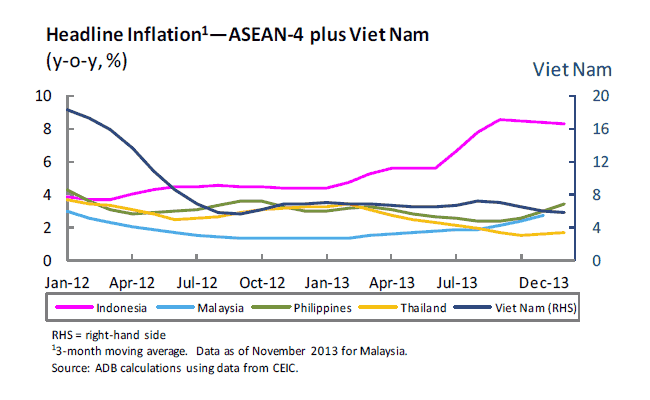
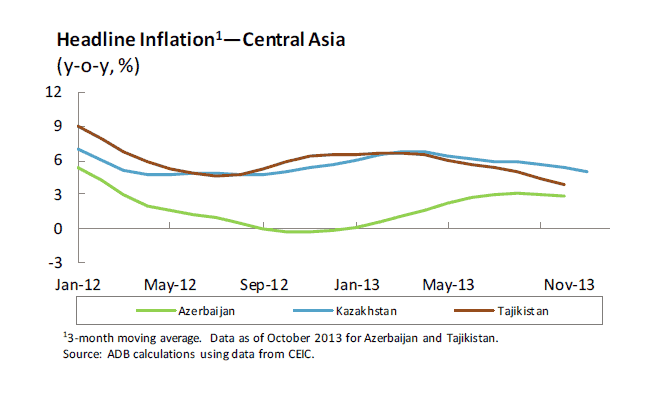
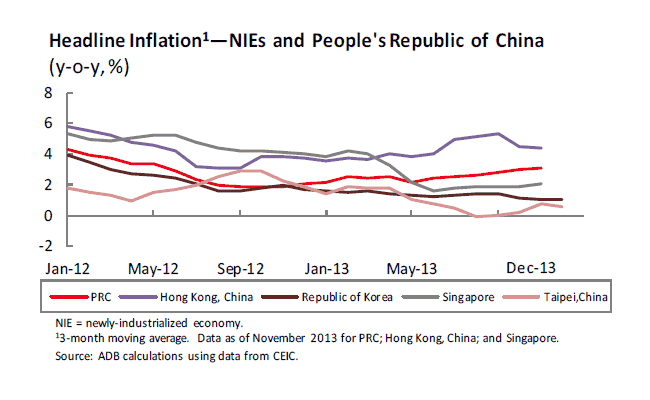
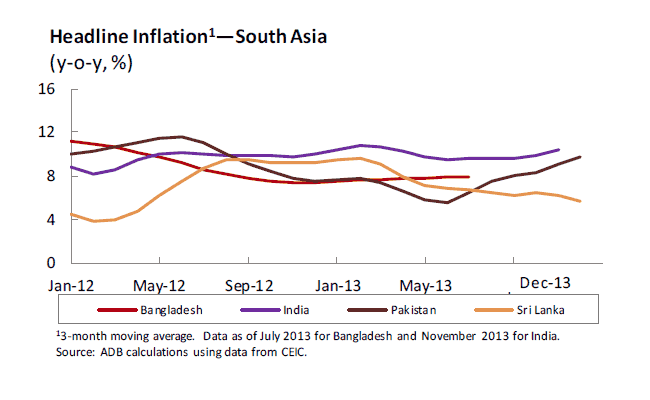
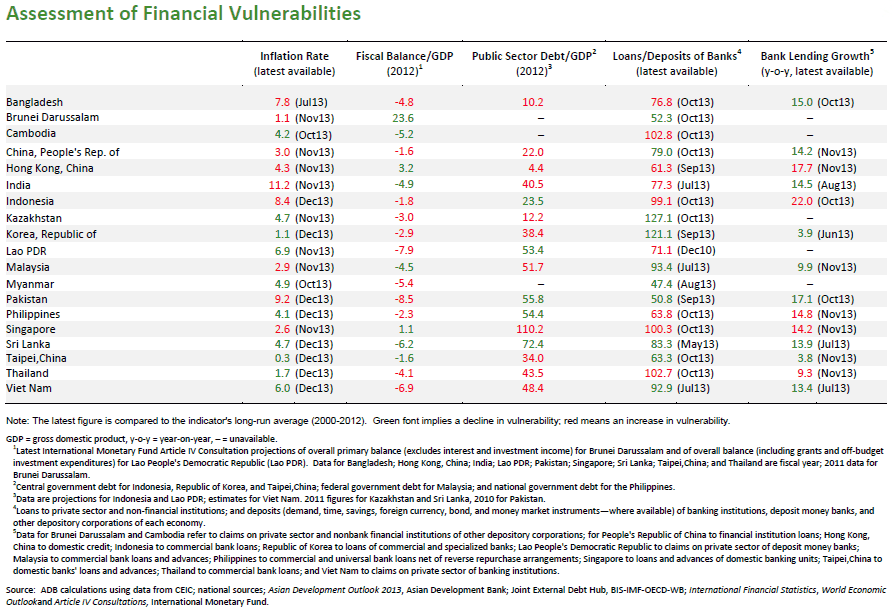
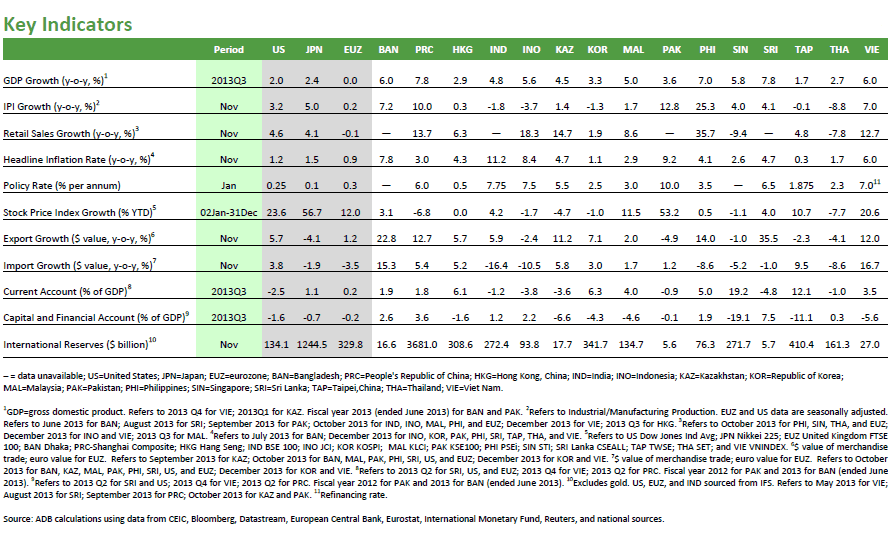
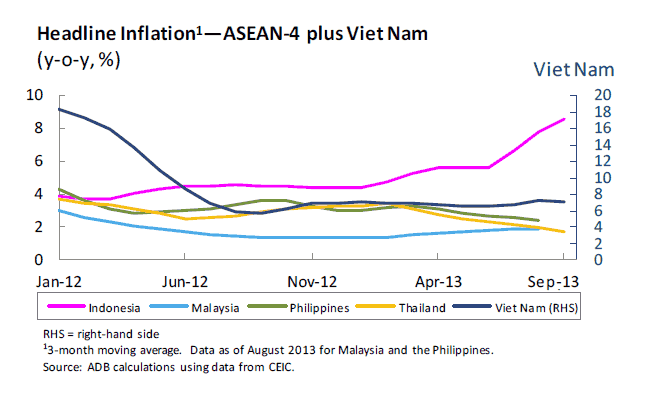
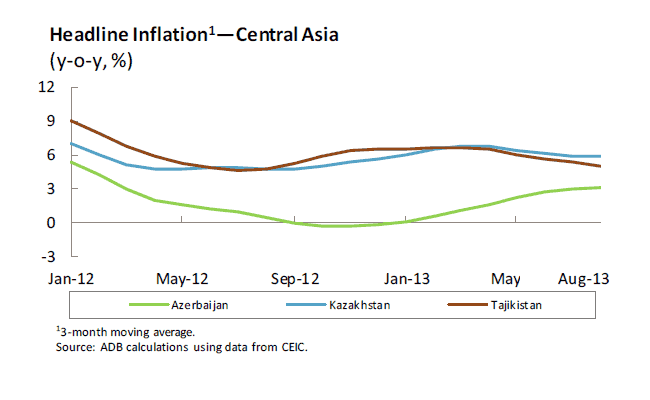
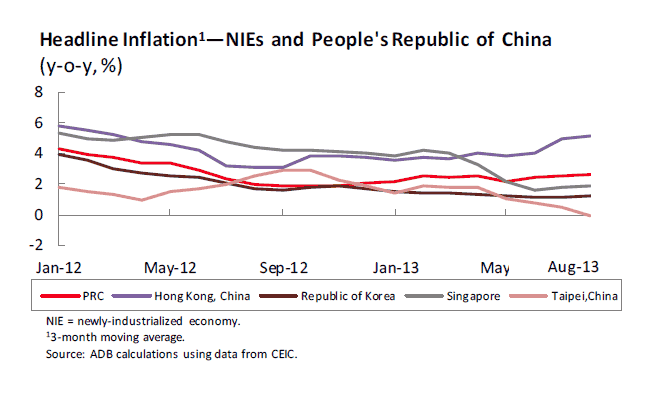
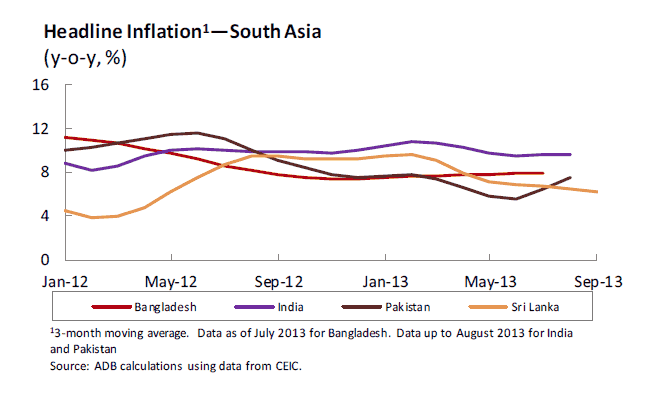
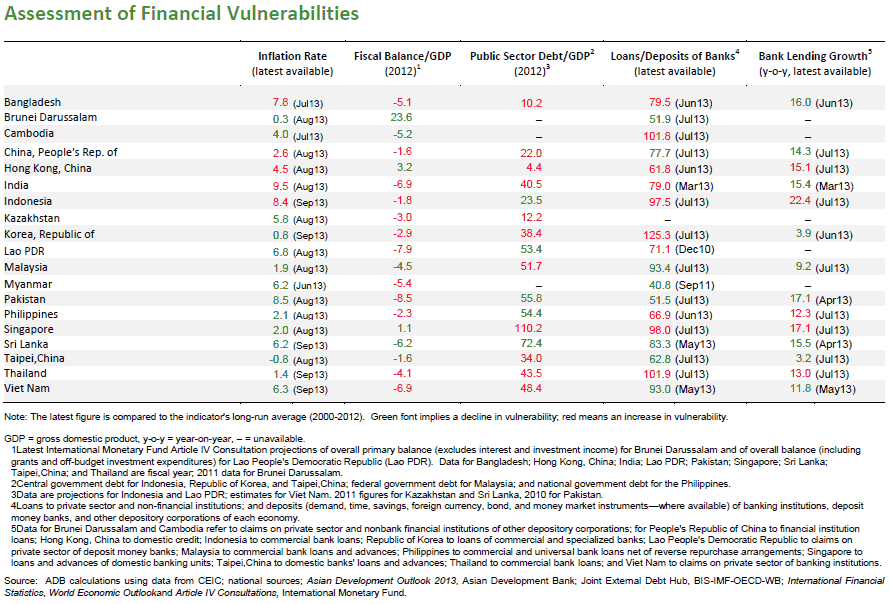
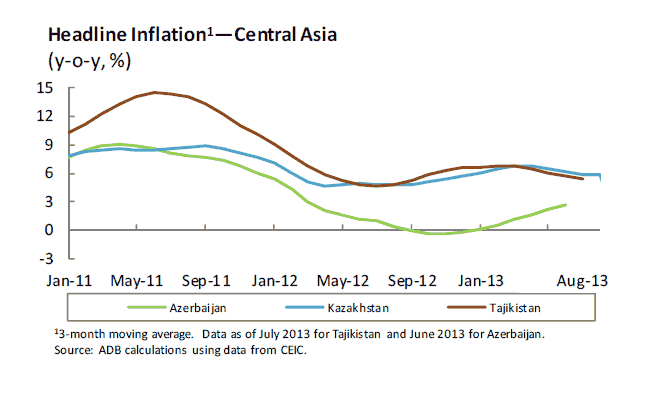
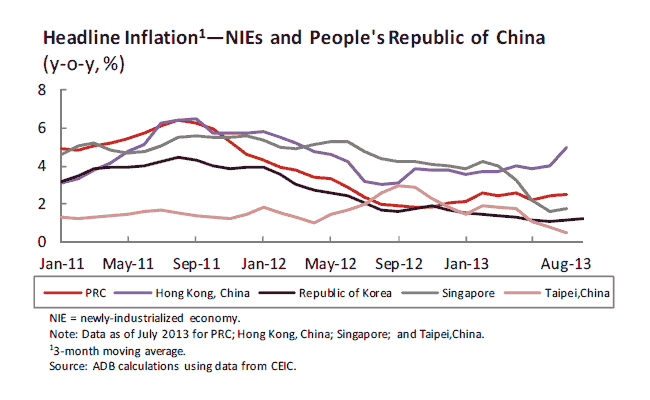
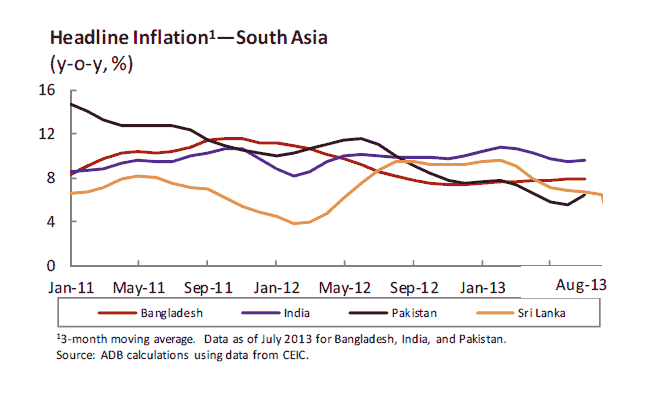
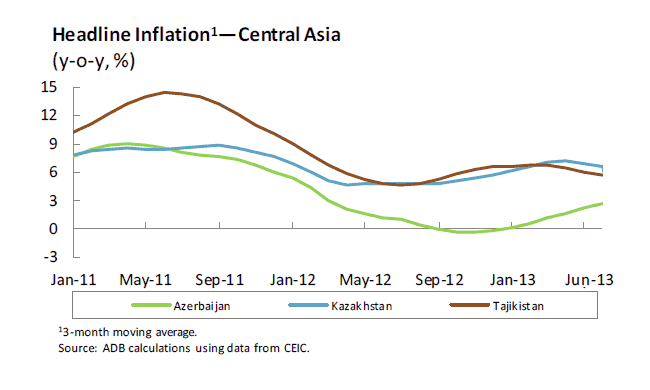
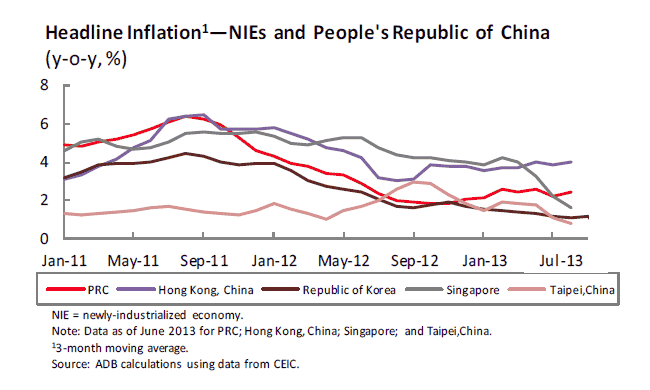
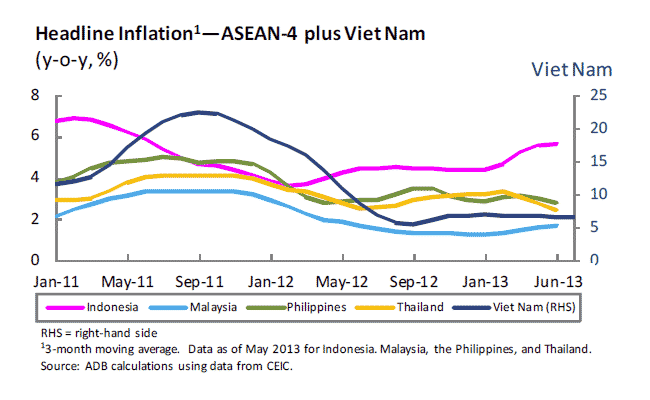
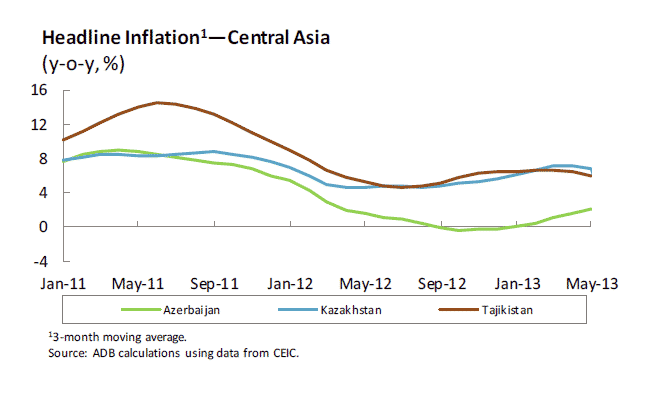
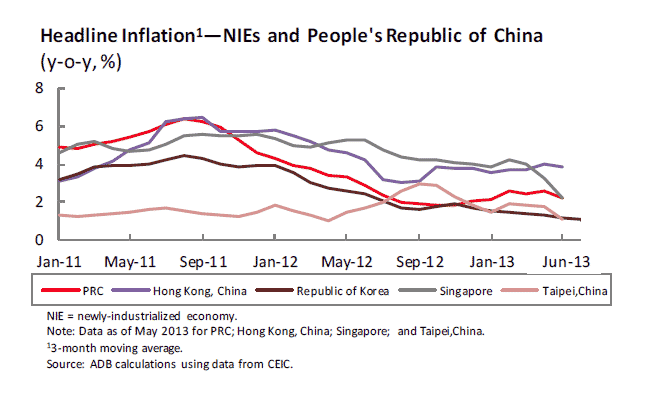
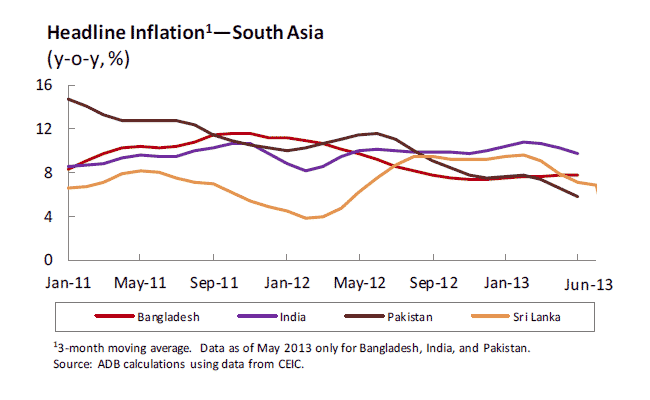
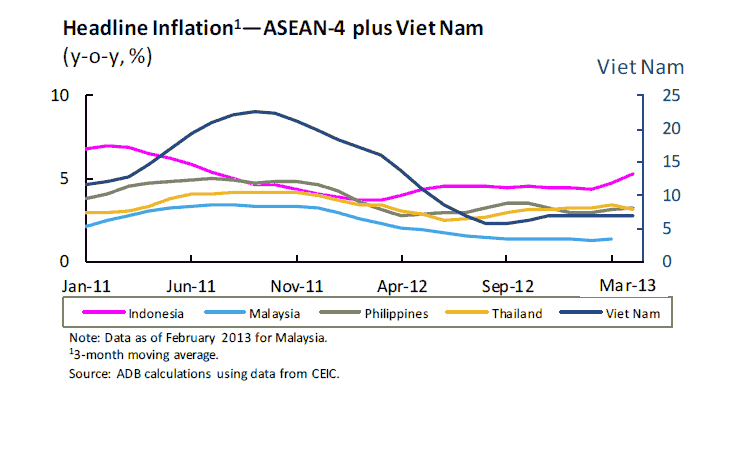
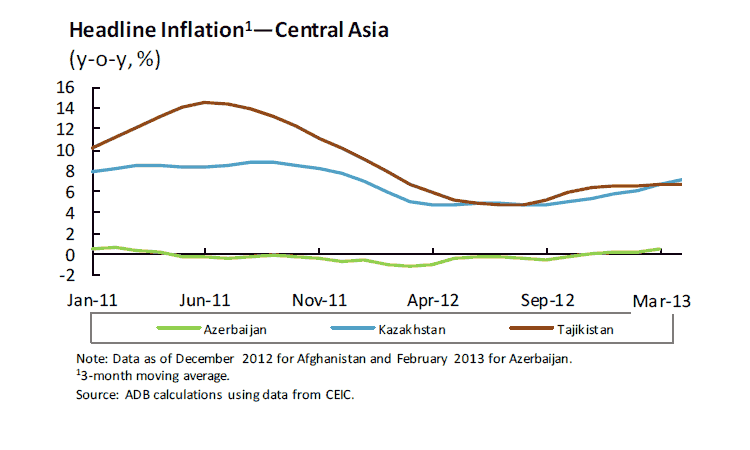
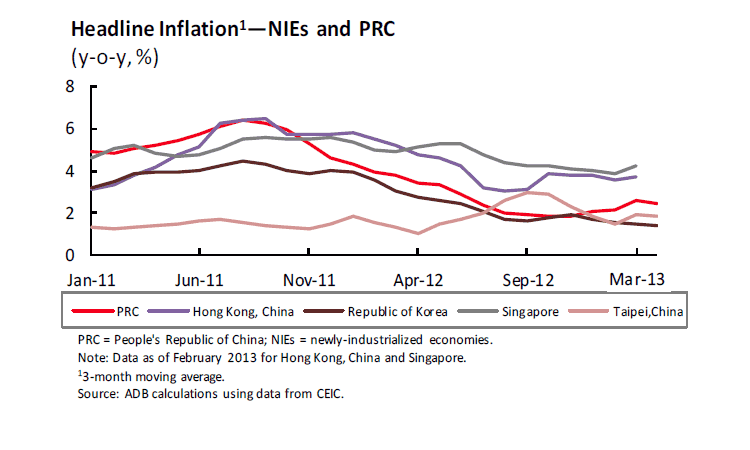
- Inflation mixed across the region.
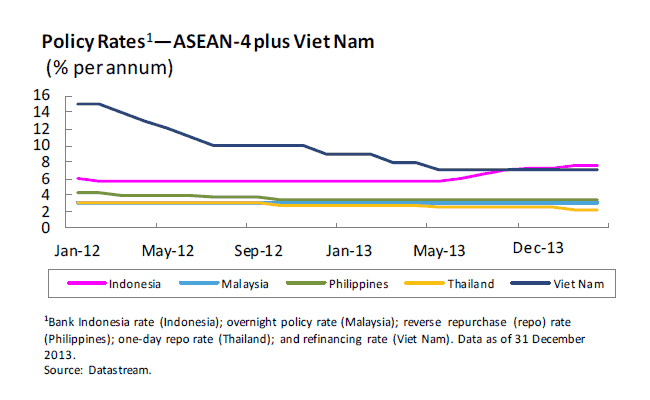
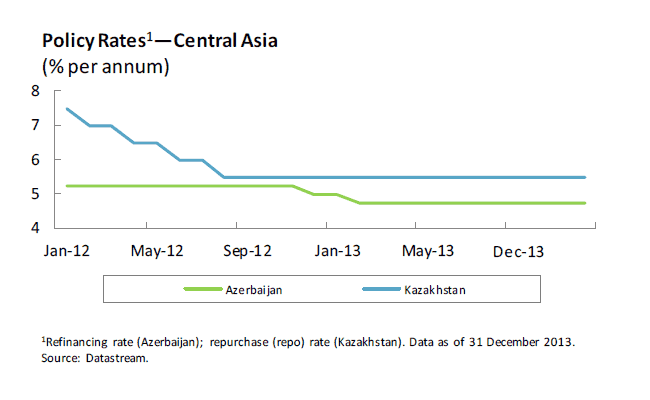
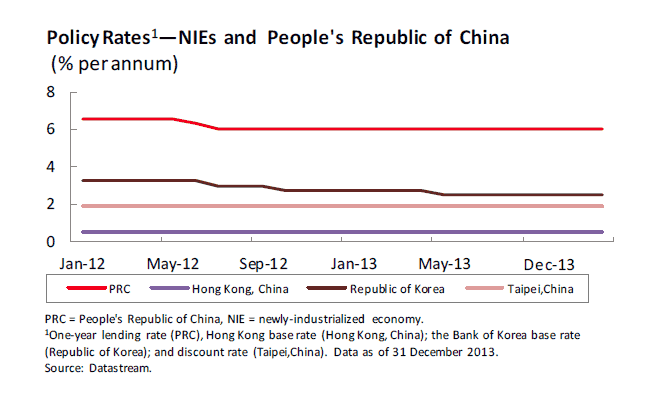
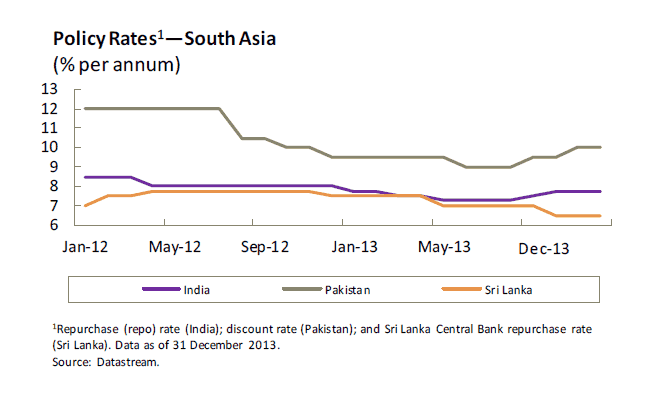
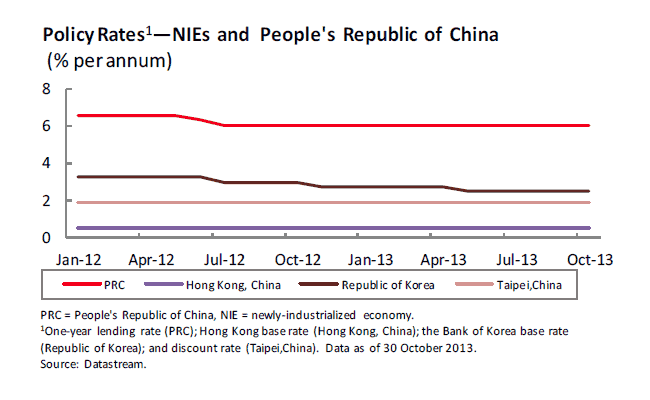
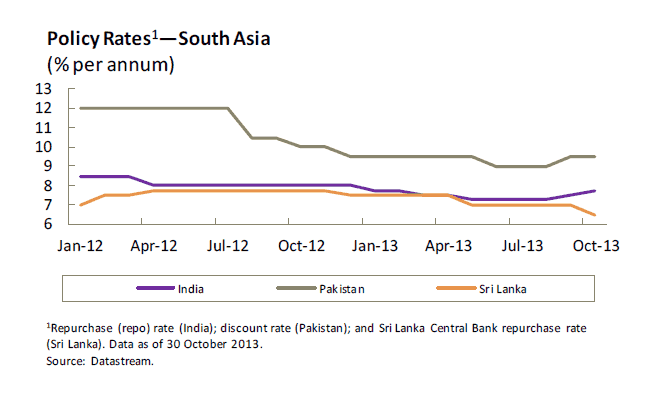
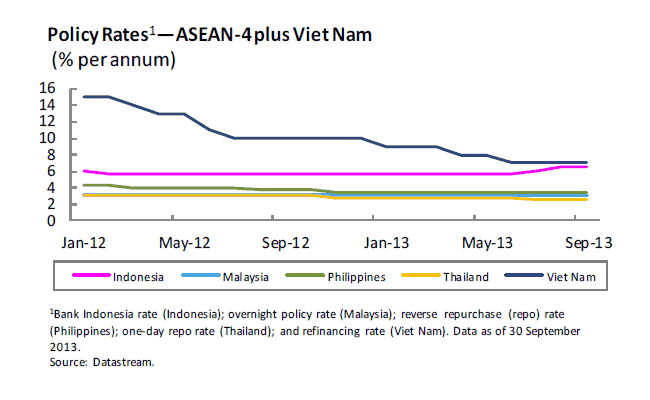
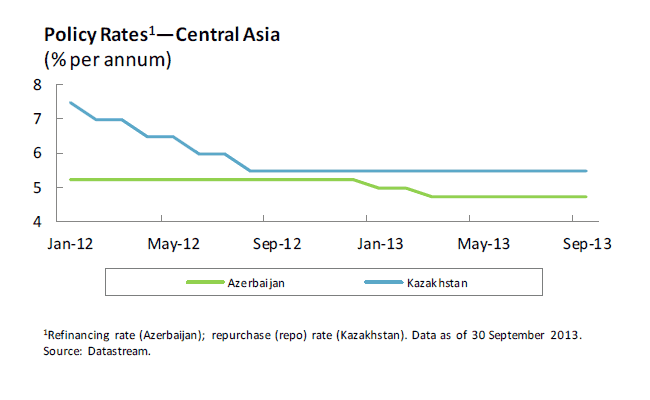
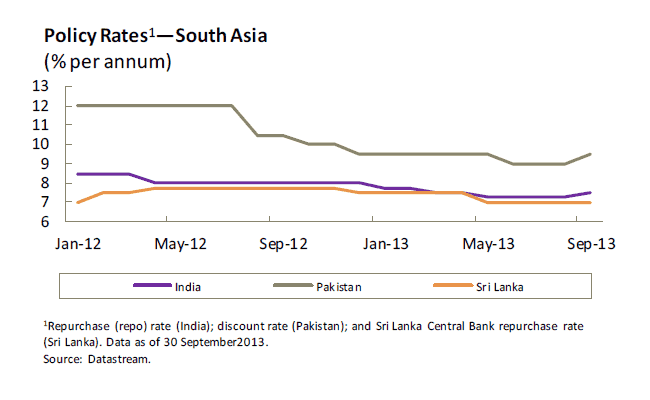
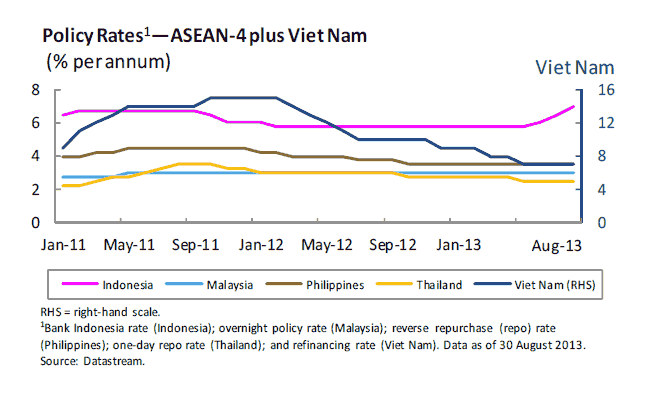
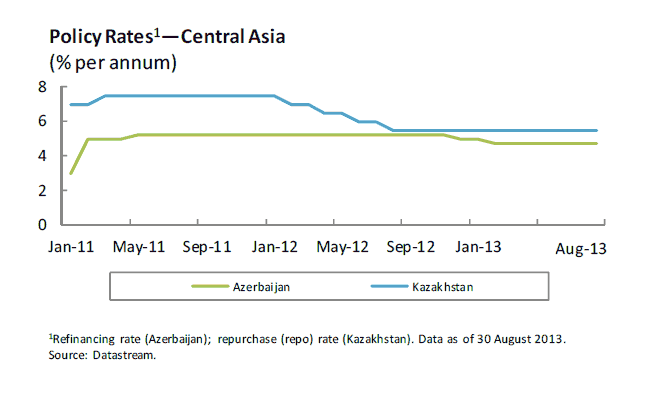
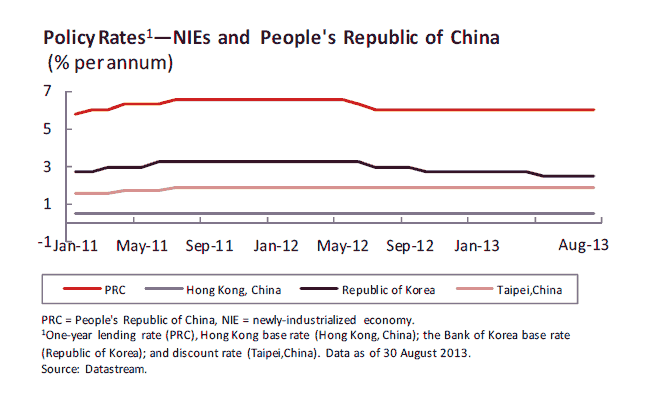
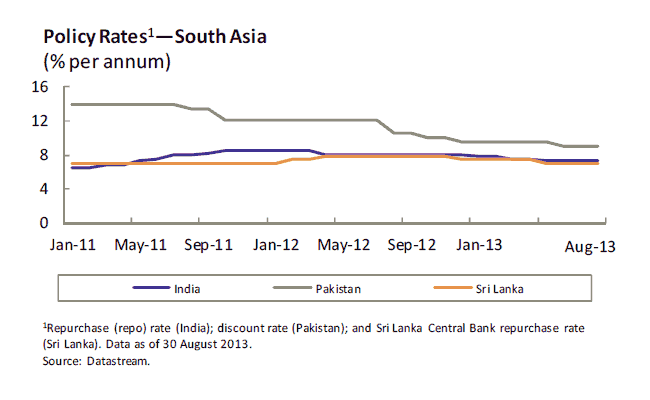
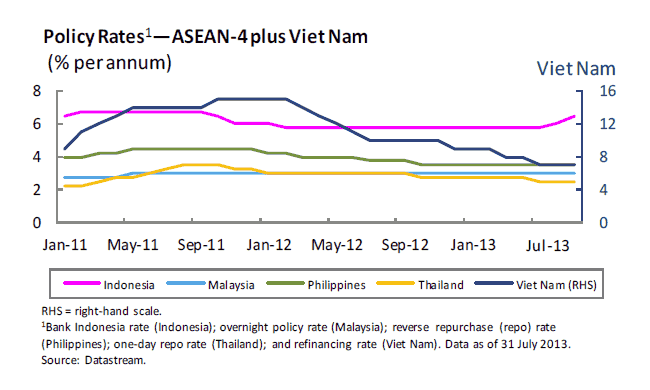
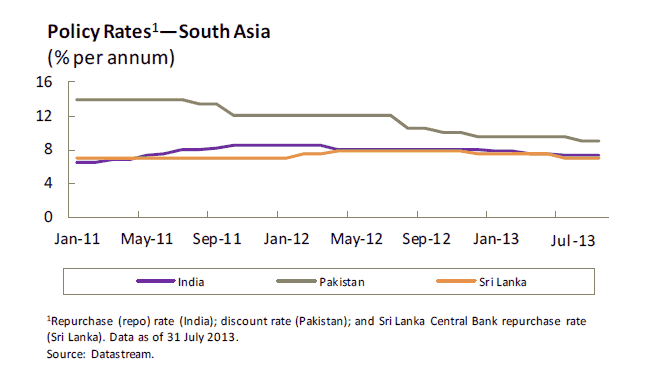
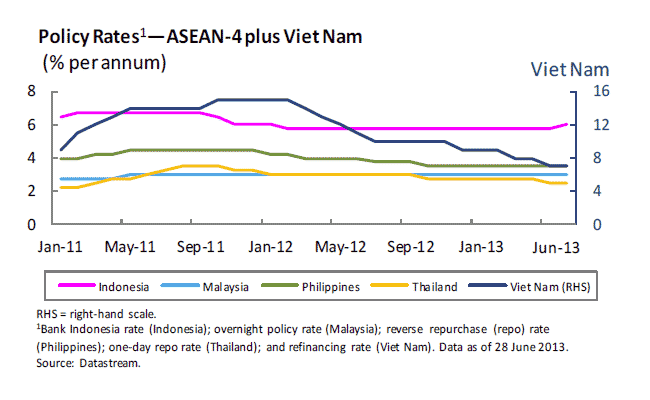
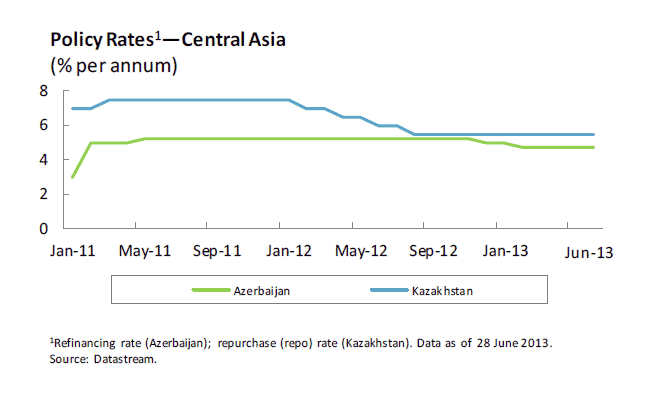
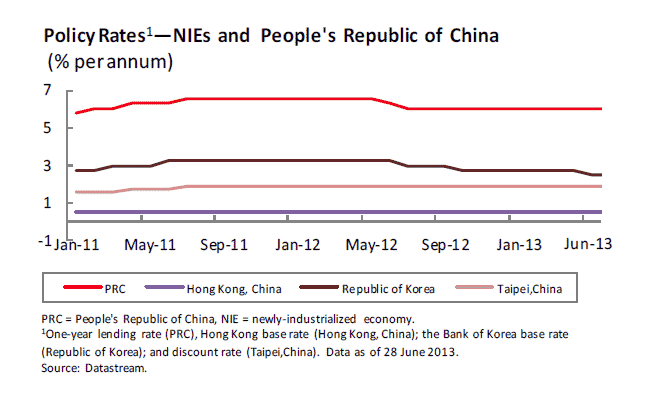
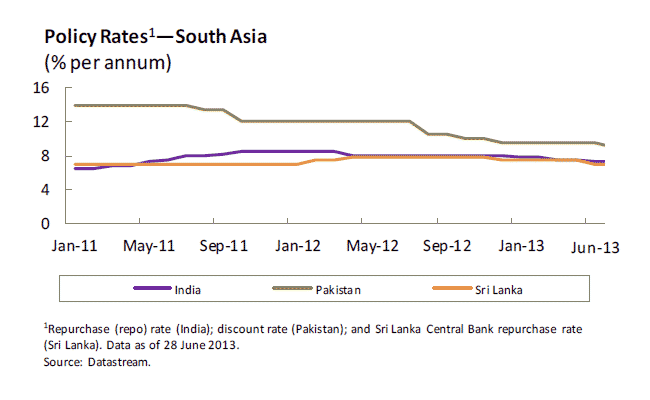
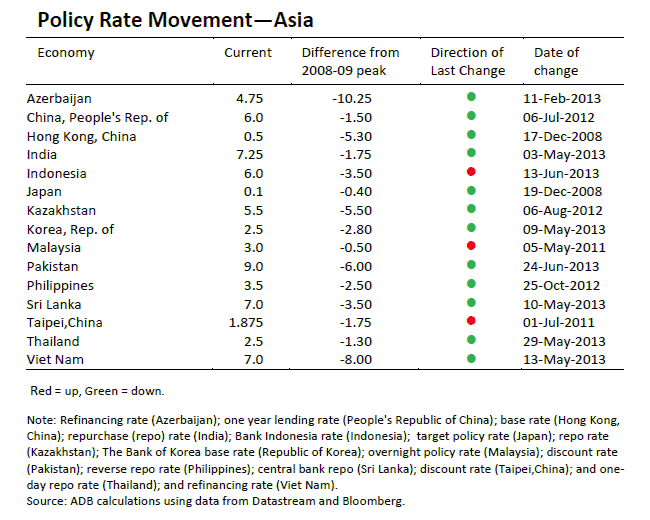
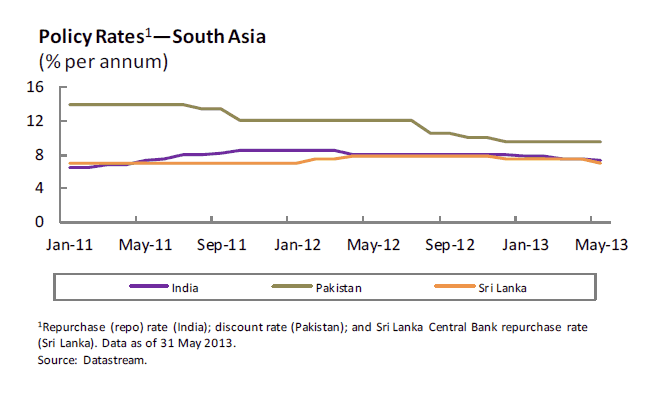
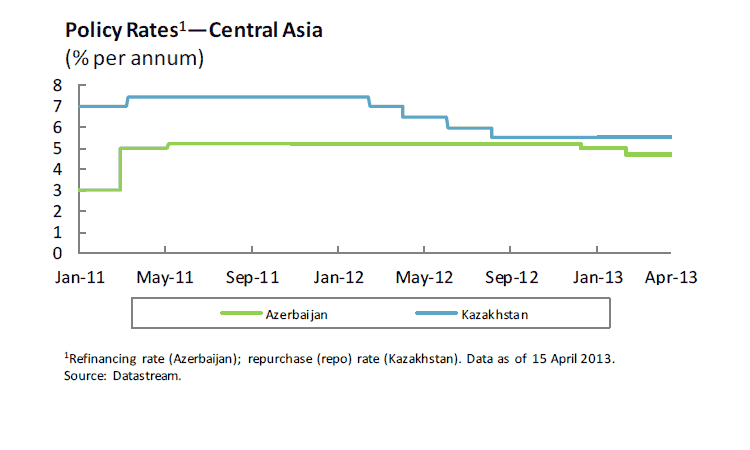
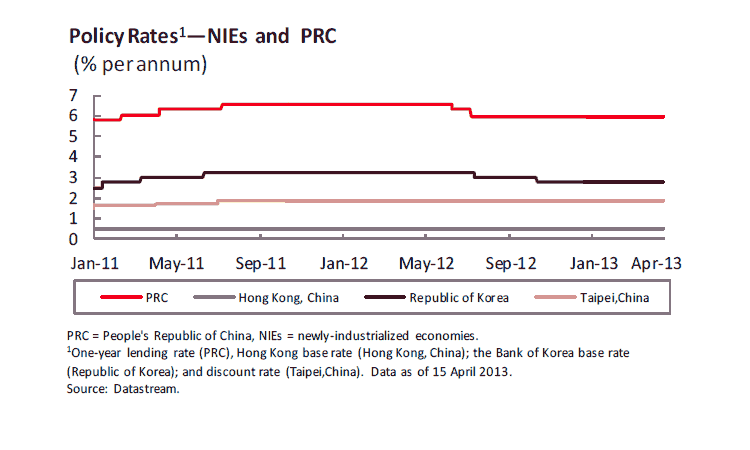
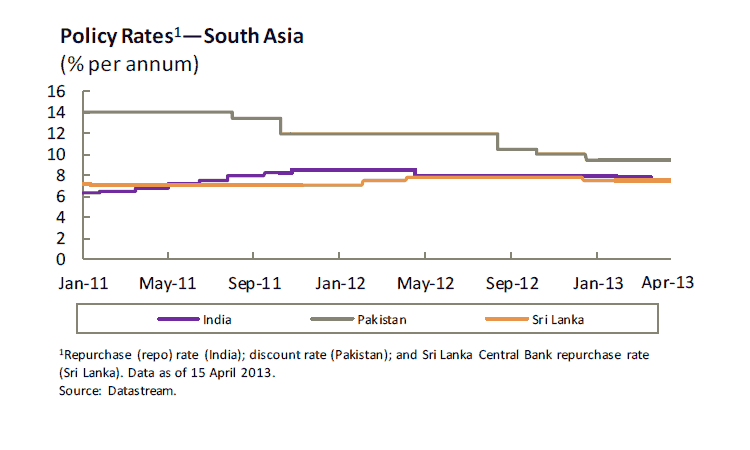
- Central banks “wait and see”.
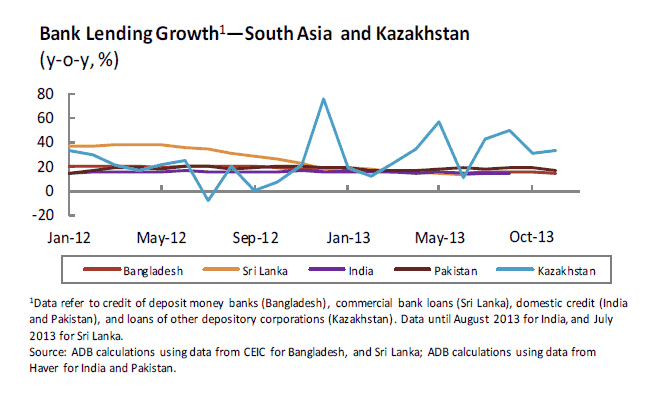
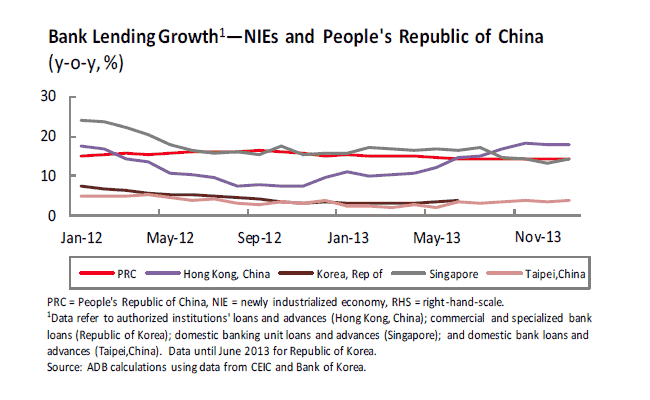
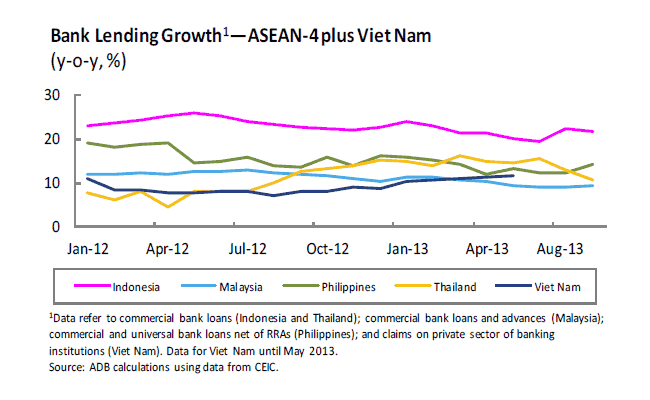
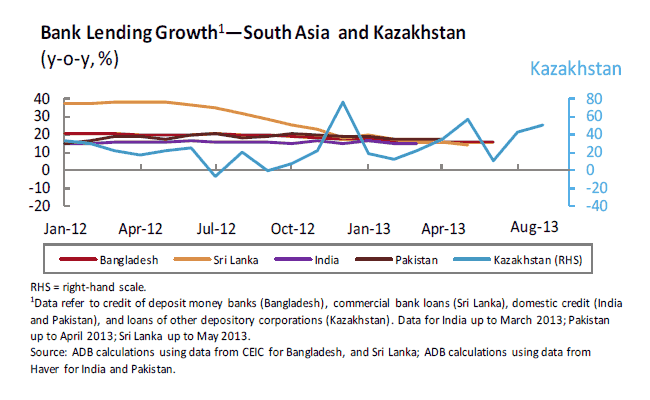
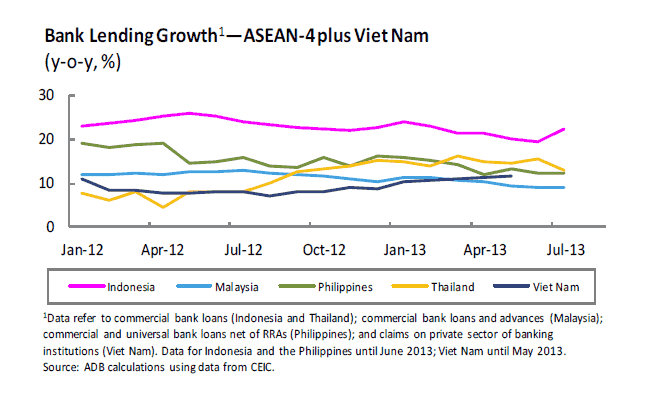
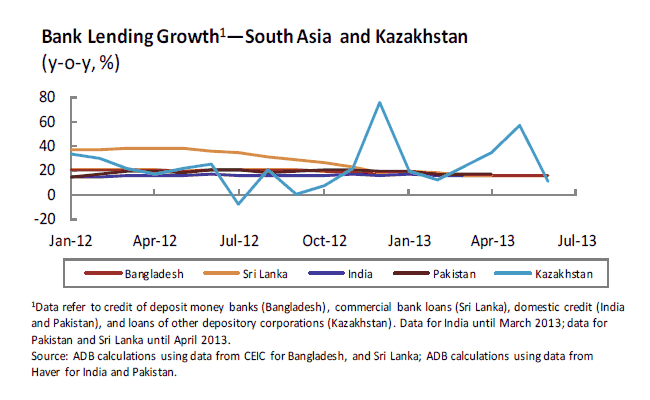
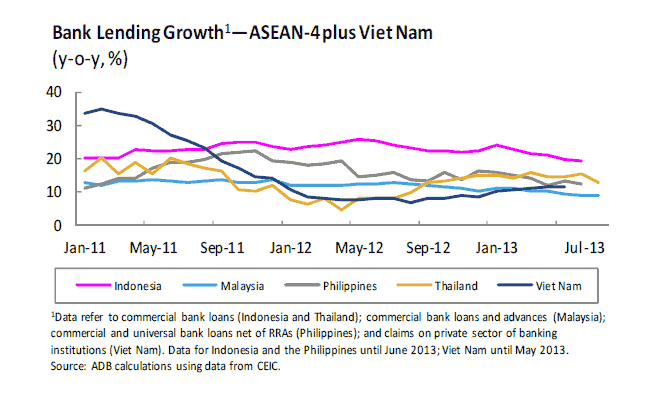
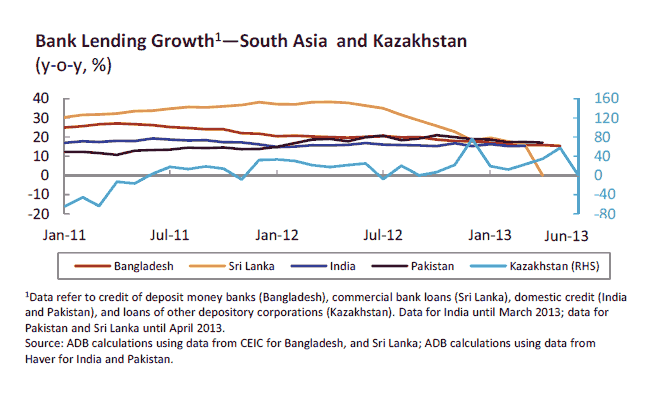
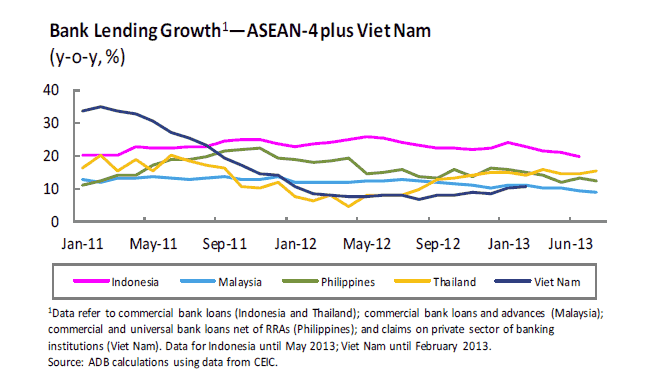
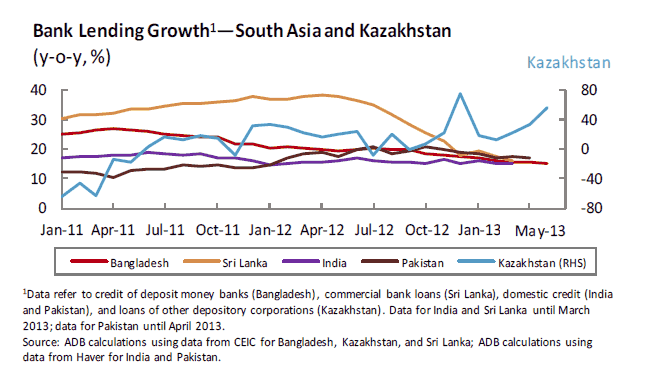
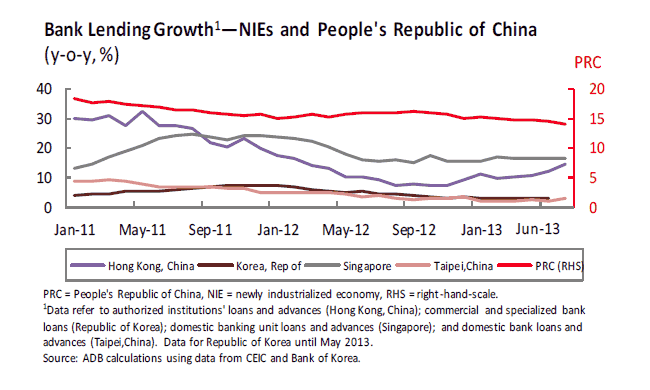
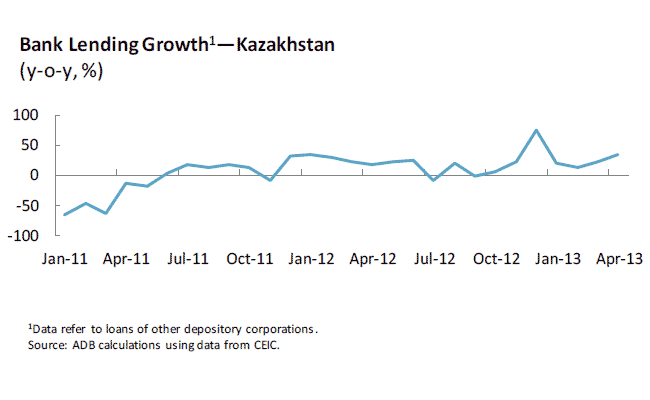
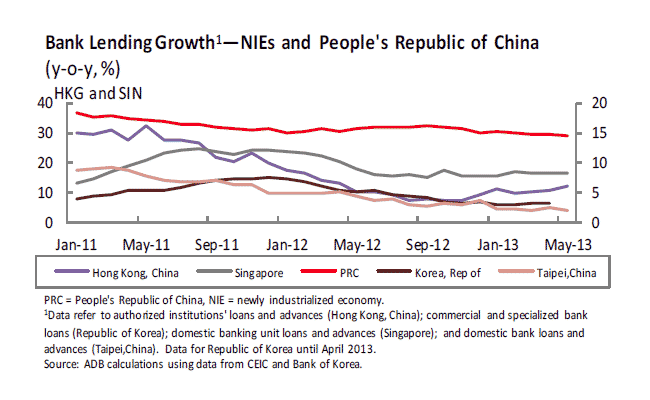
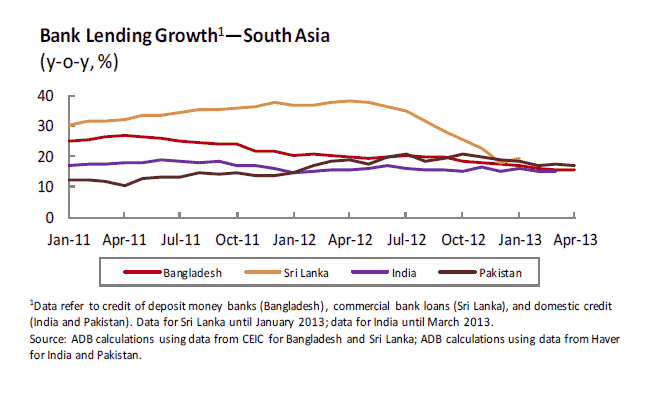
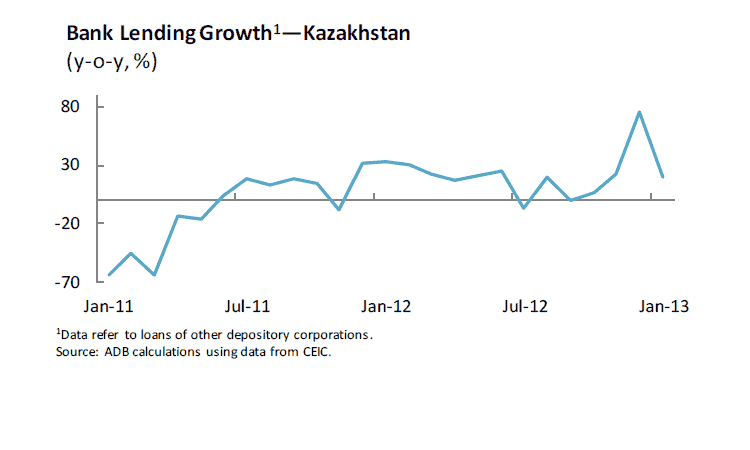
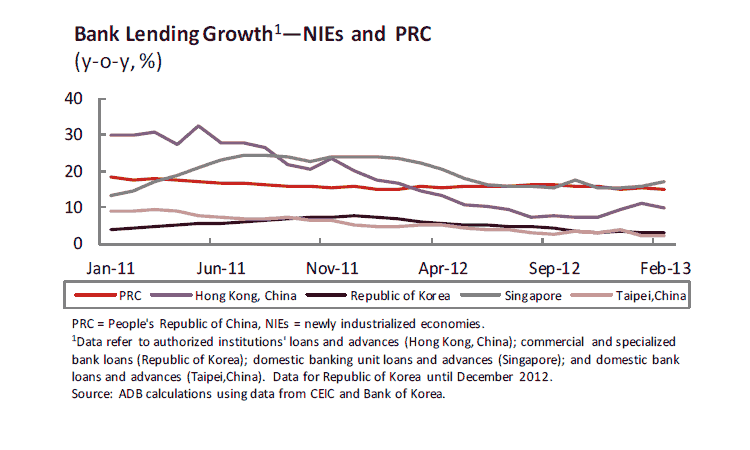
- Bank lending slows in Thailand amid bad loan risk.
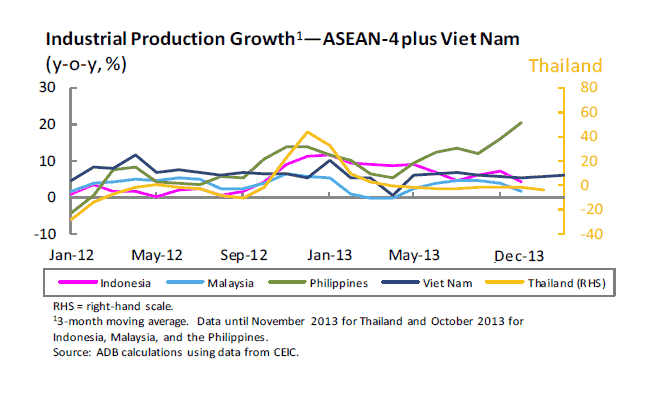
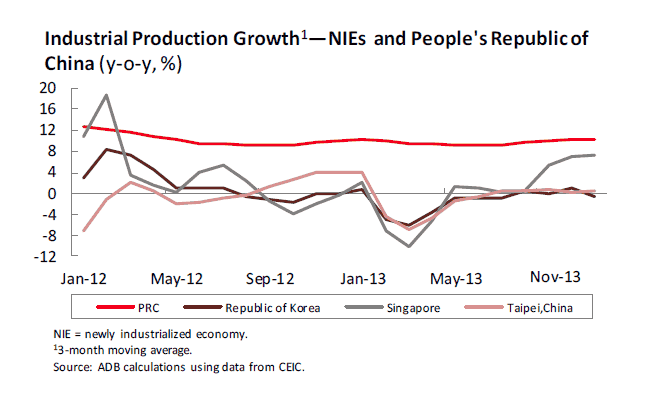
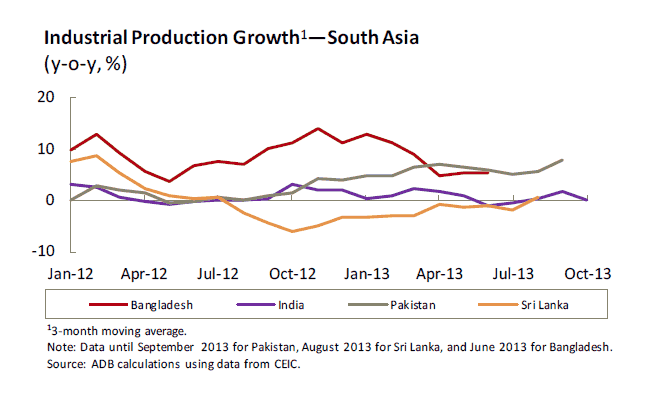
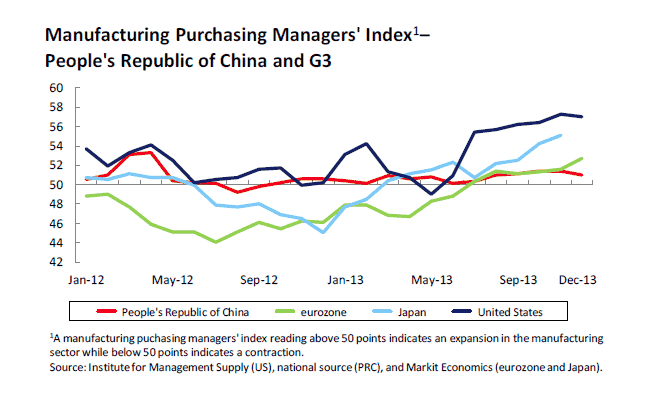
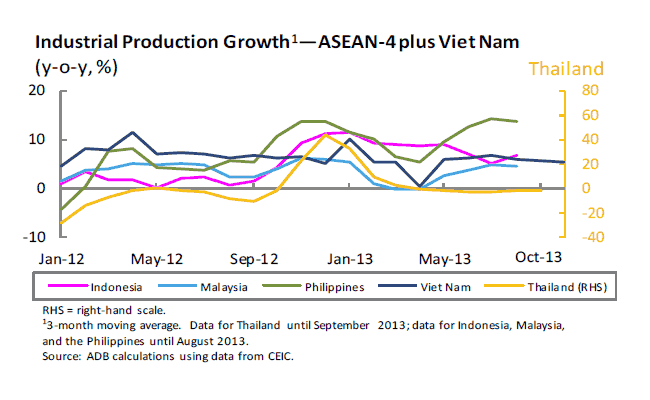
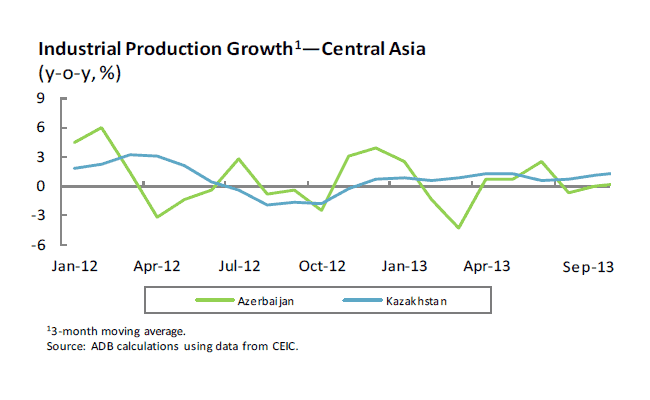
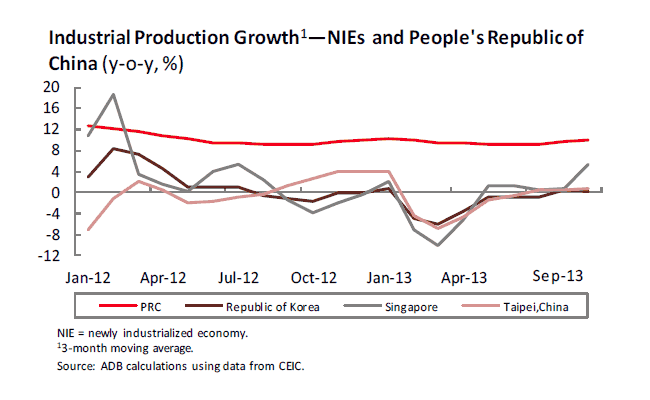
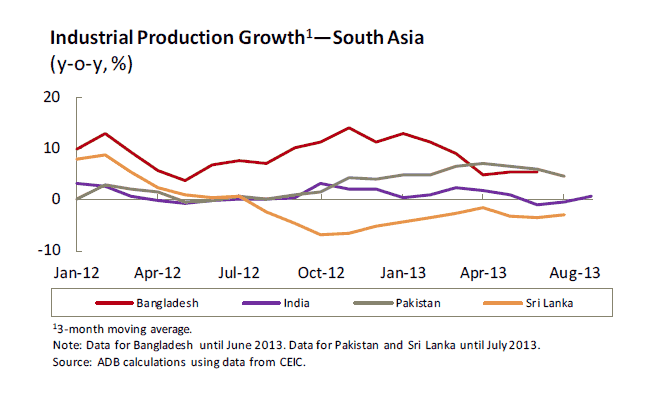
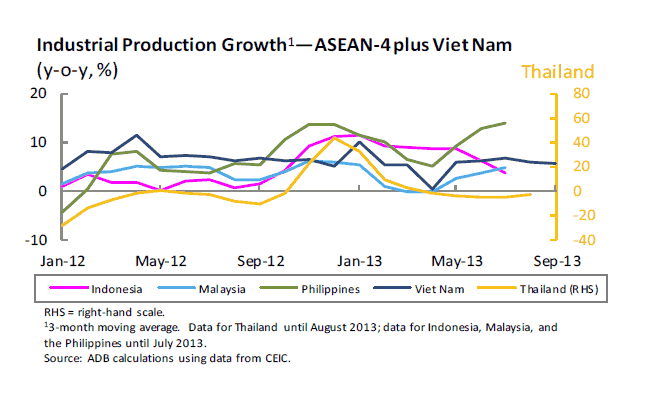
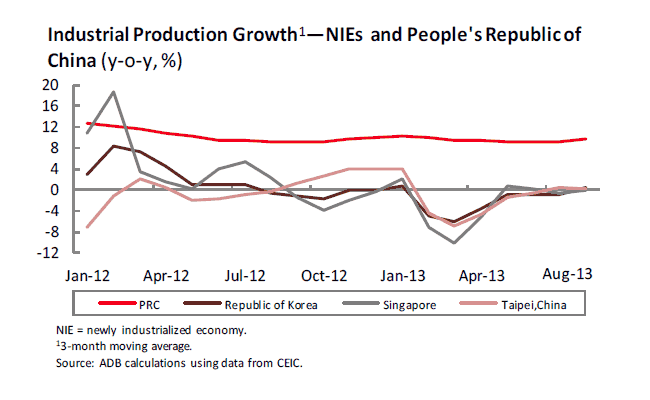
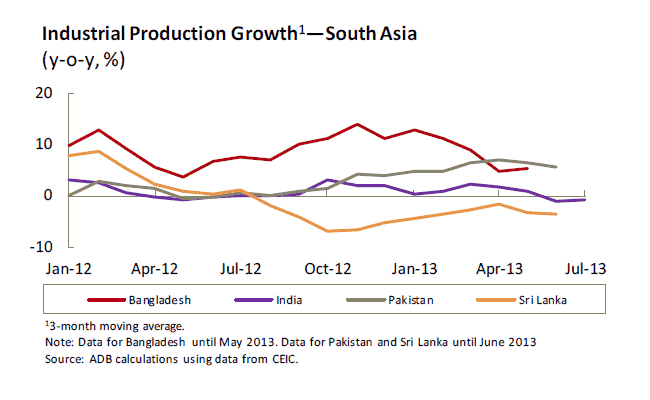
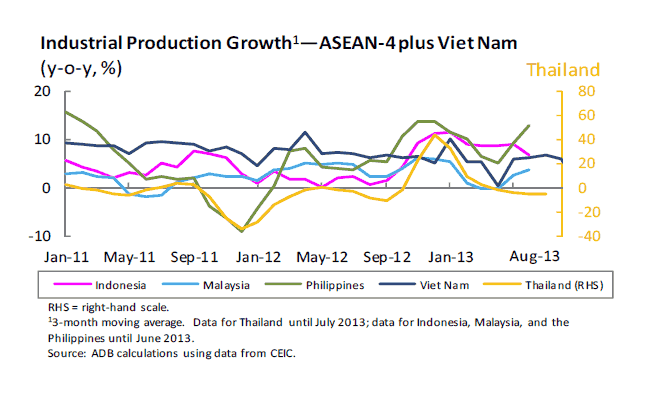
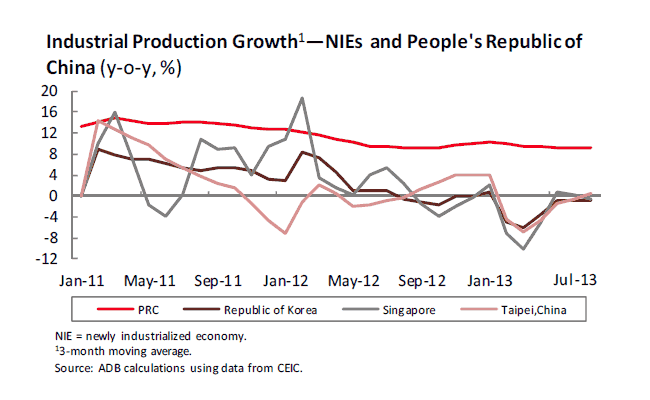
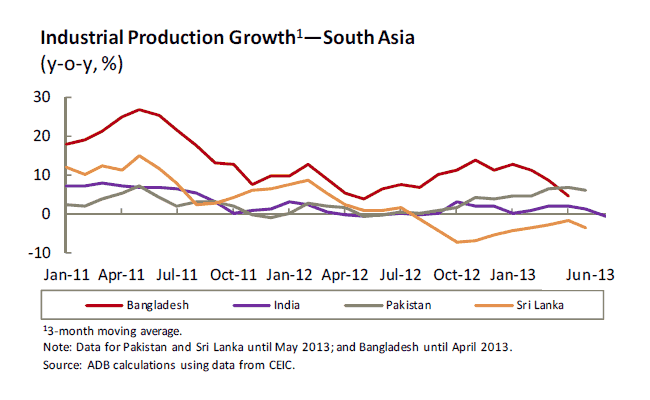
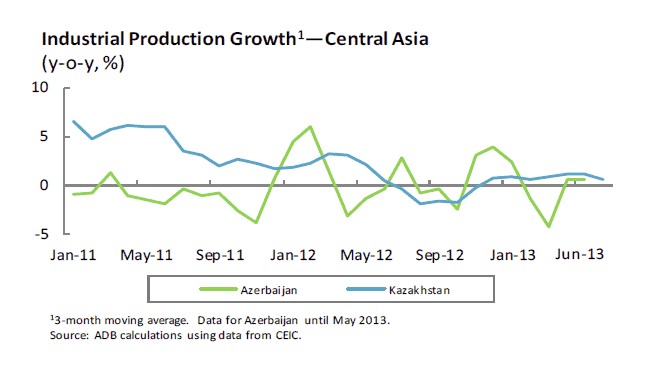
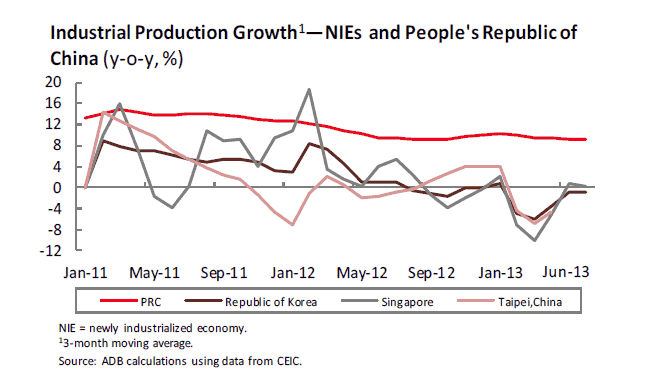
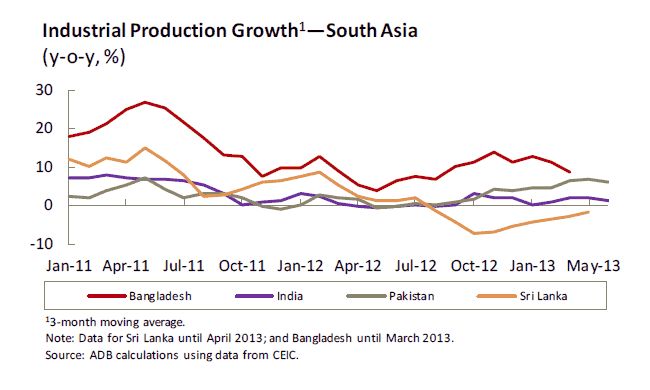
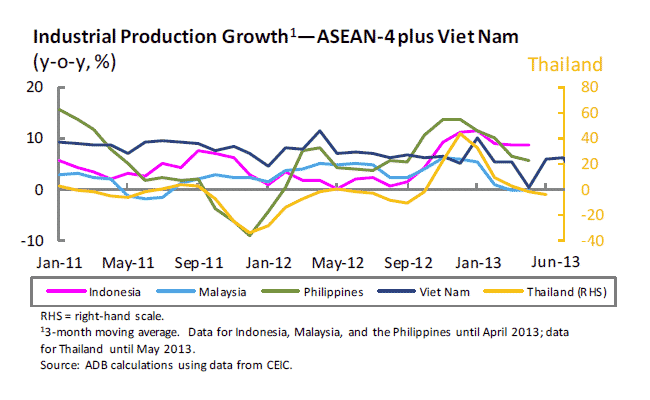
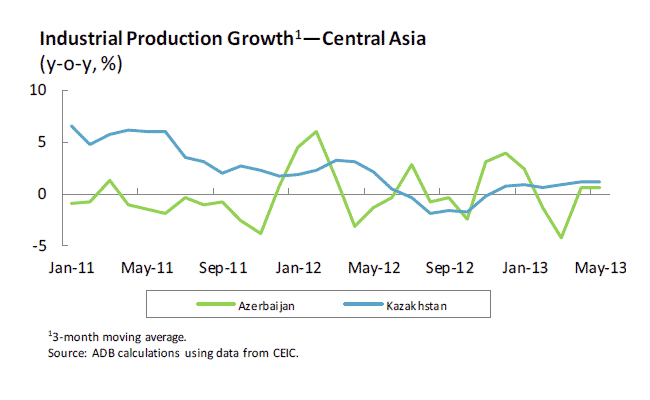
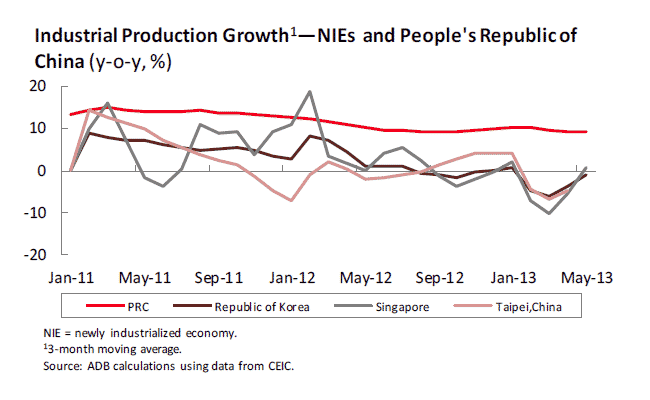
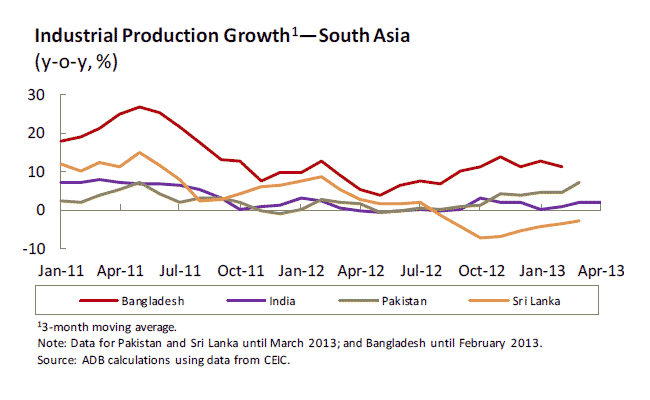
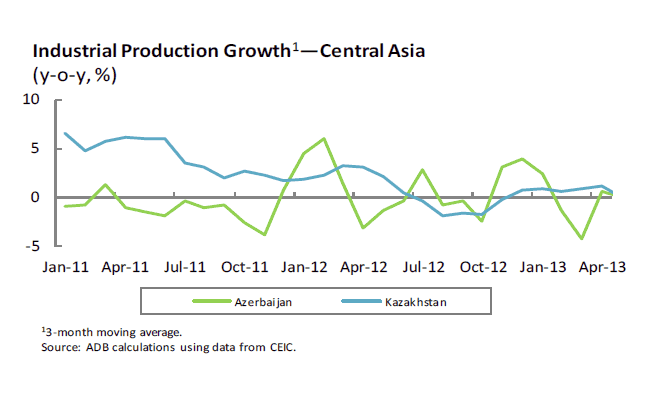
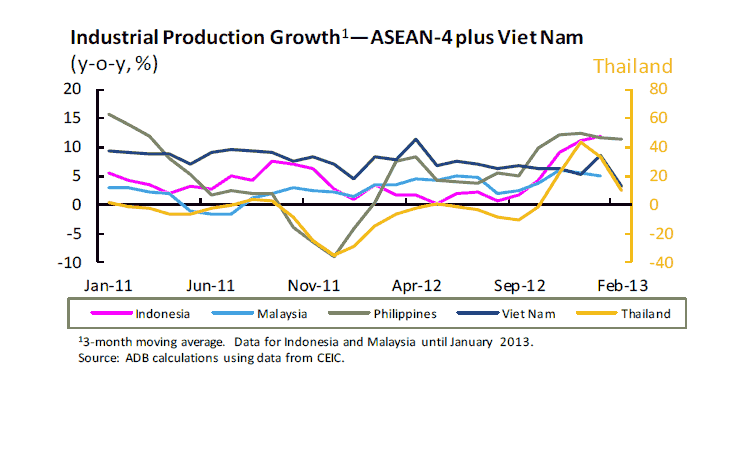
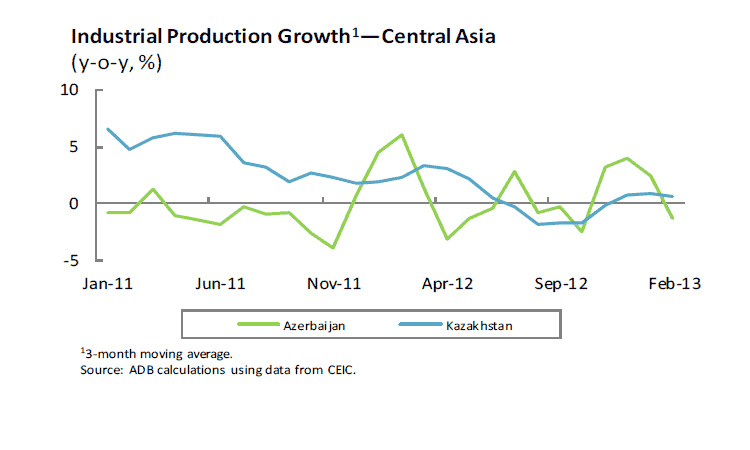
- Asian manufacturing output mostly flat.
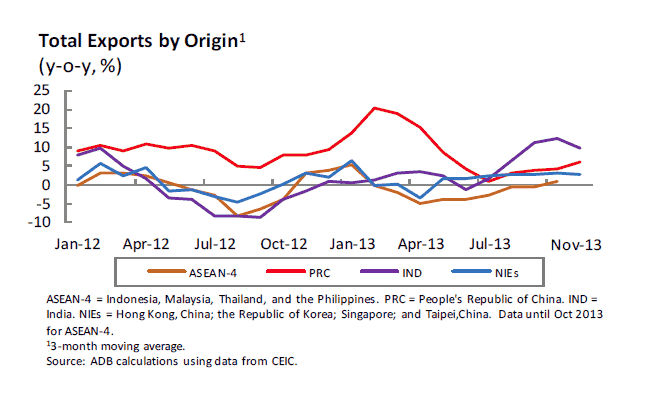
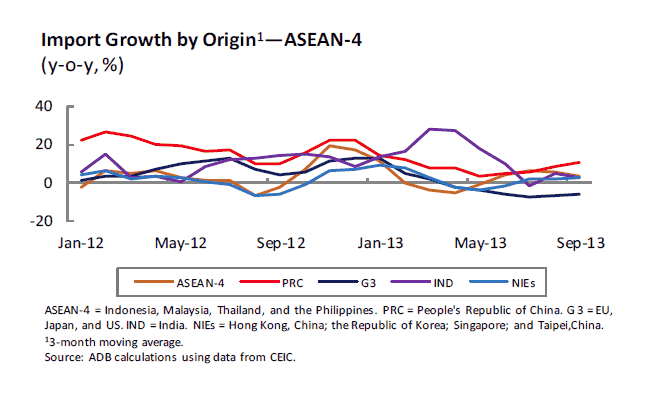
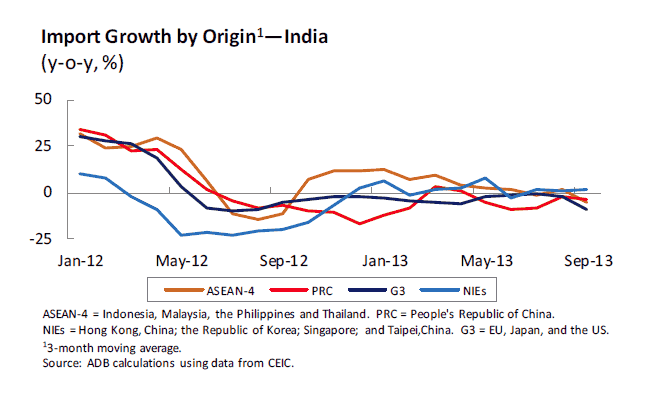
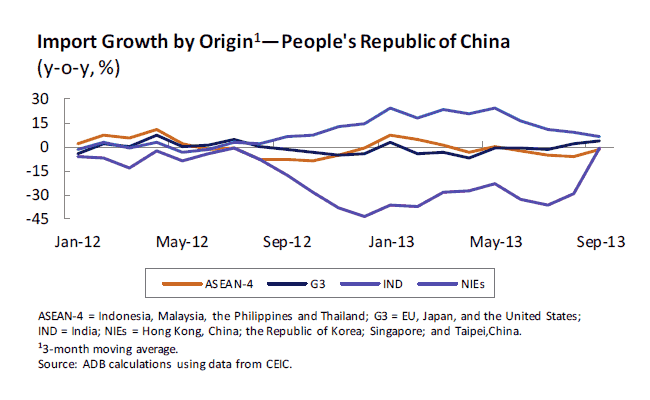
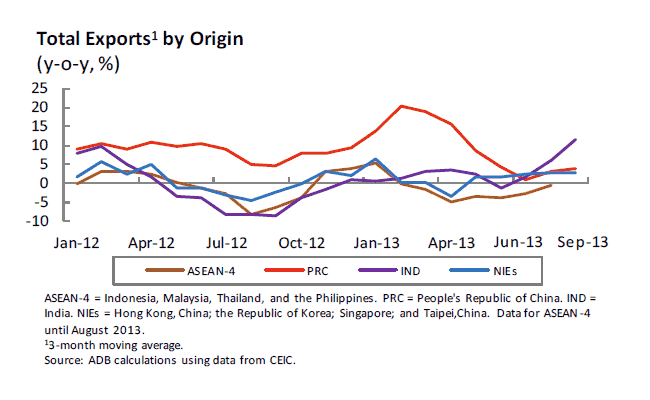
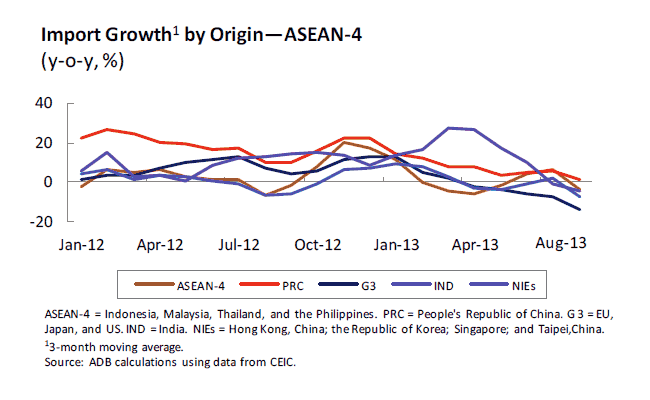
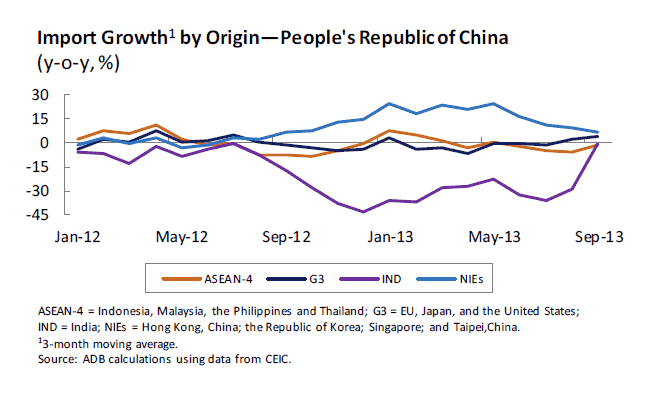
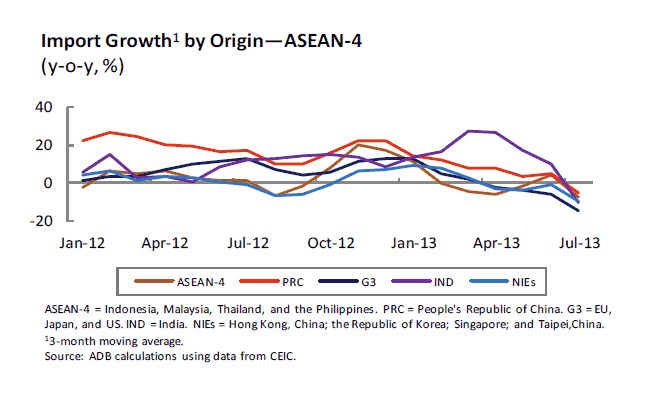
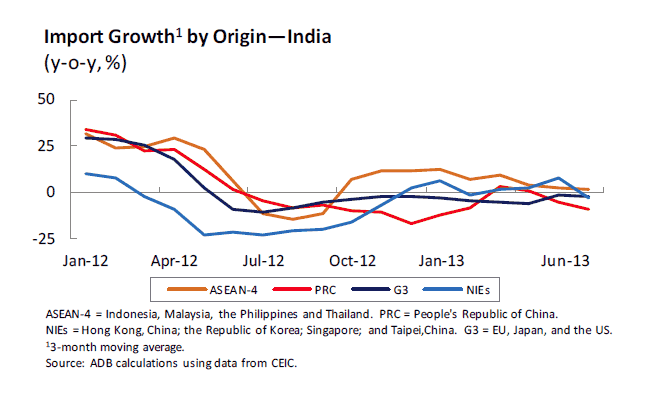
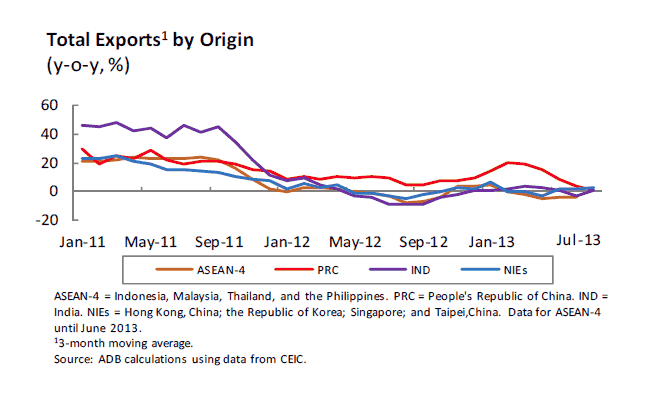
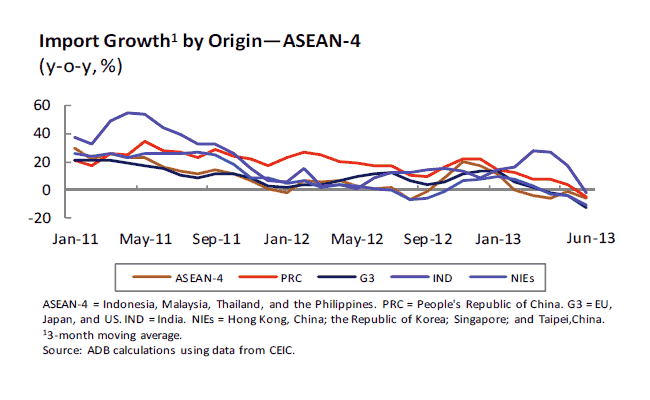
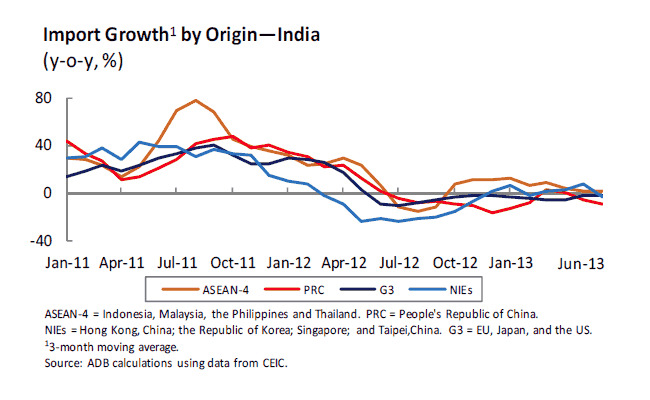
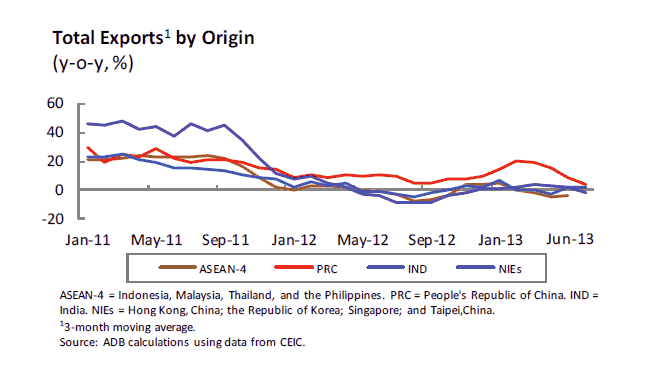
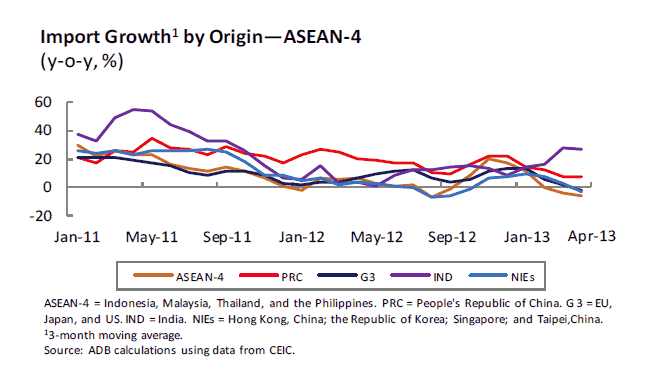
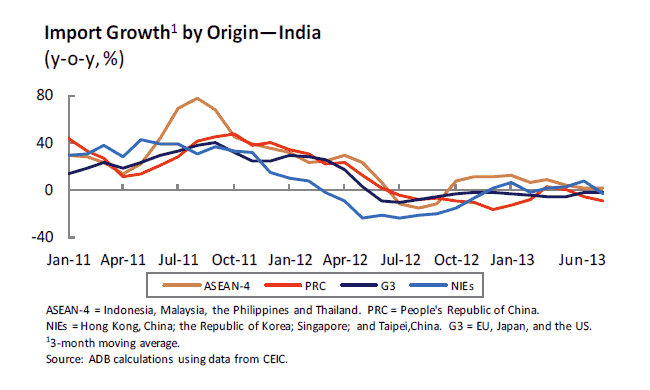
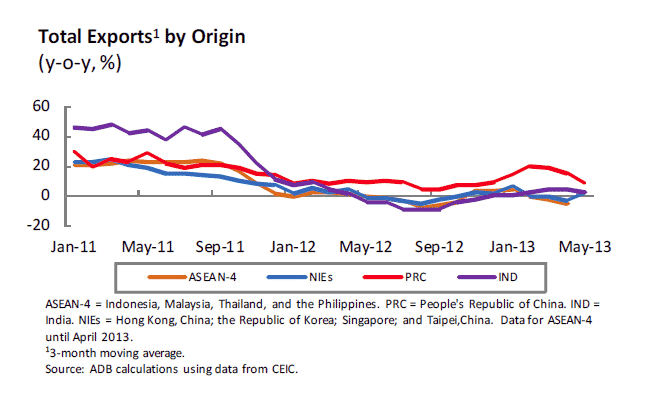
- Total export growth up, but imports still weak.
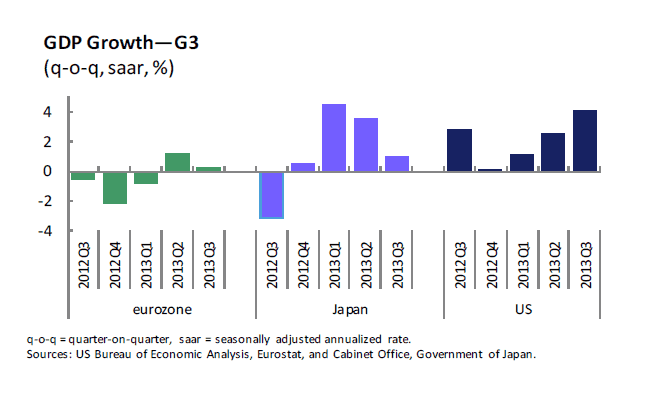
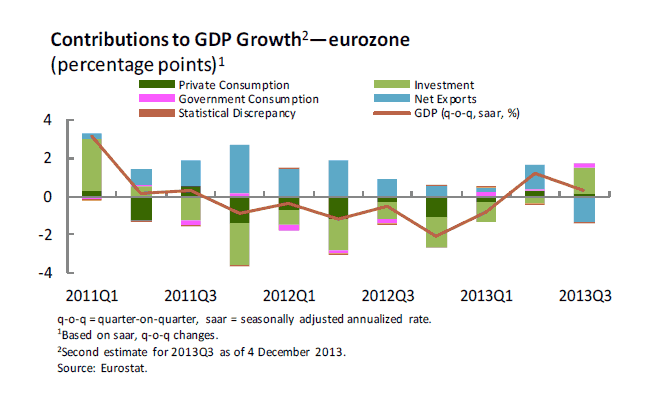
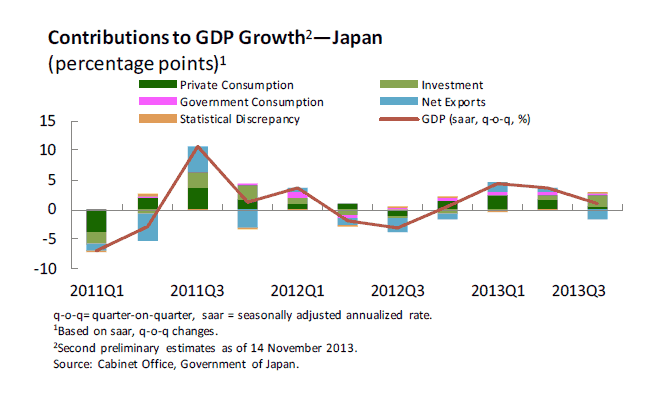
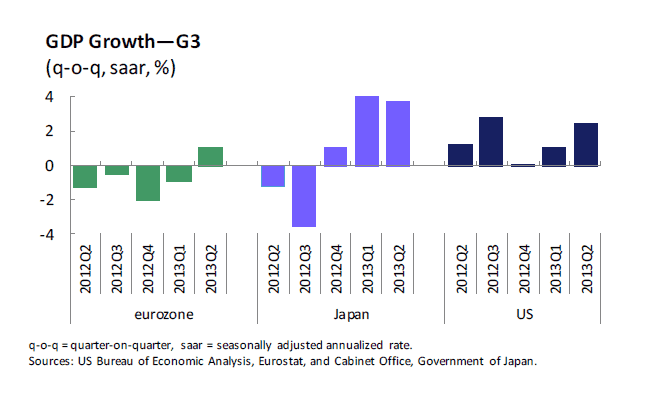
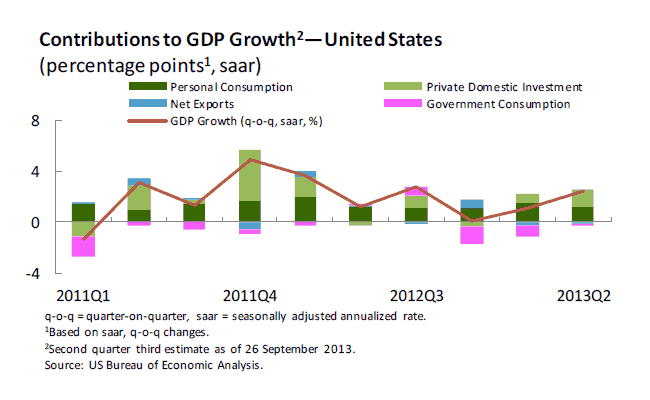
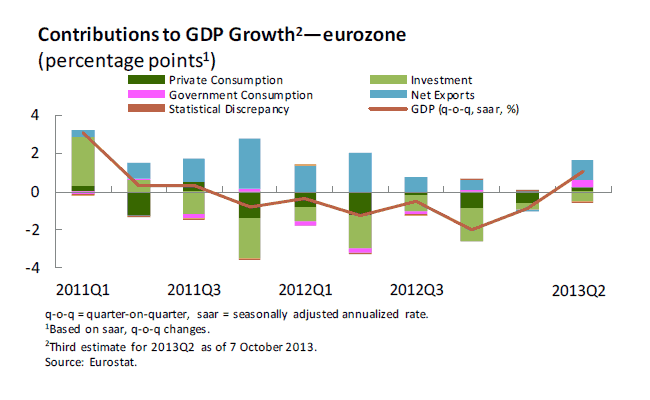
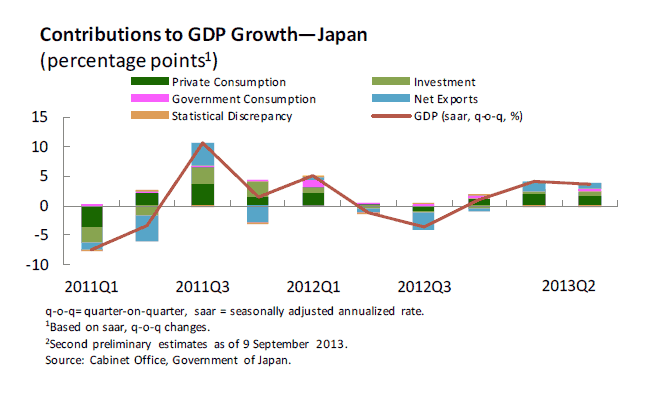
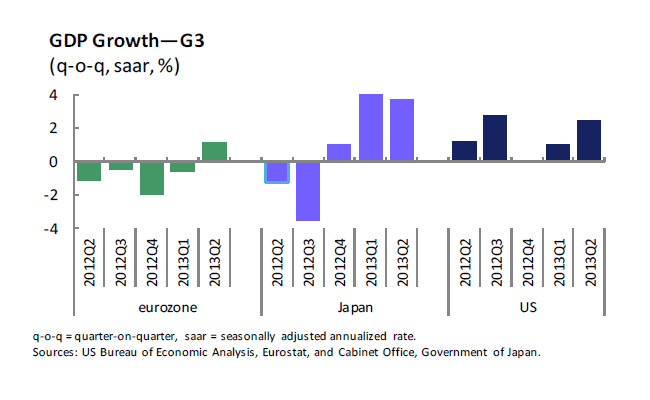
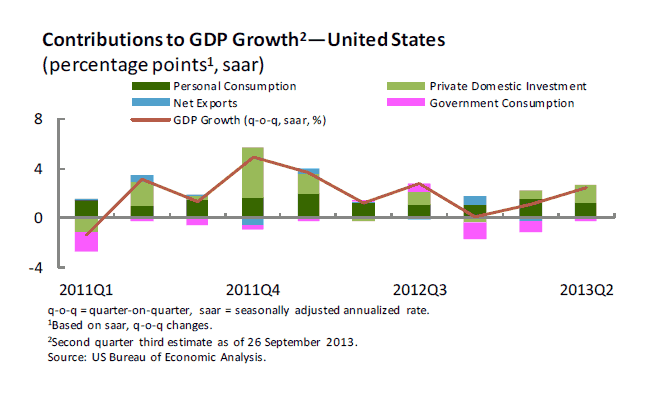
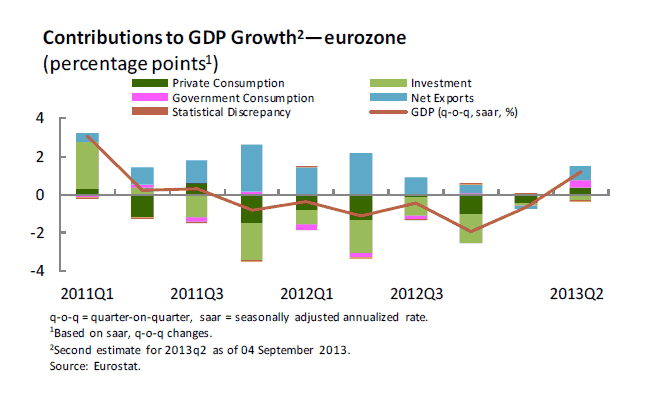
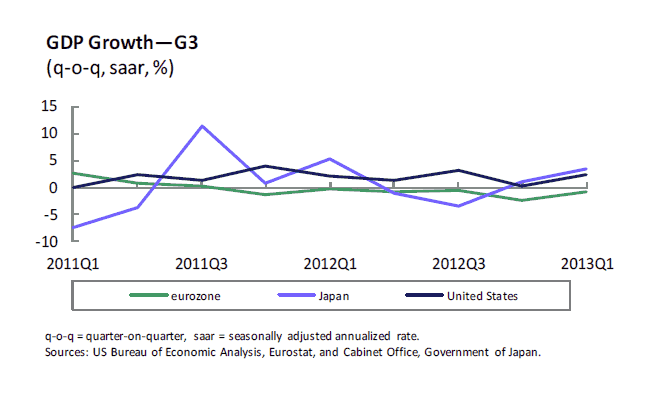
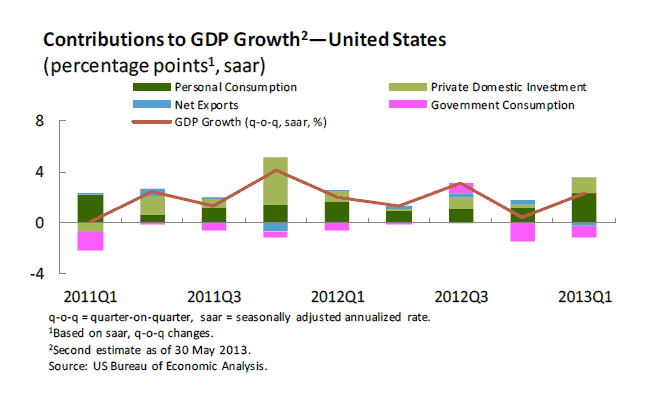
- US economy grows faster in Q3; EU, Japan slow.
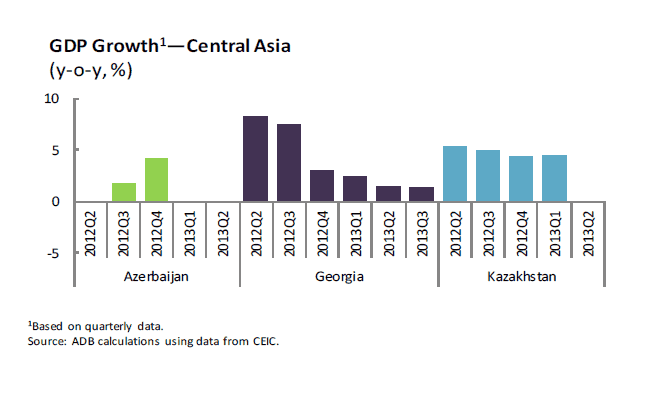
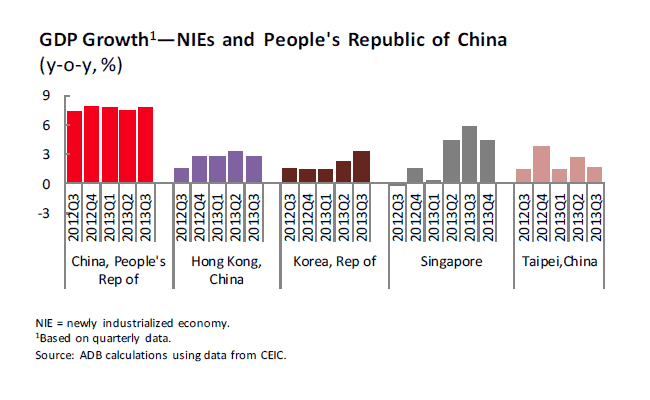
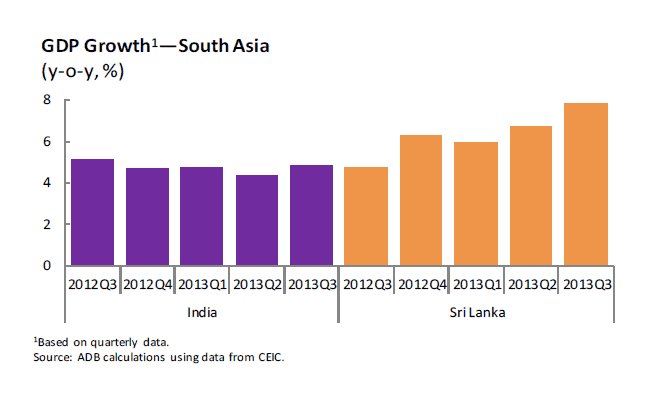
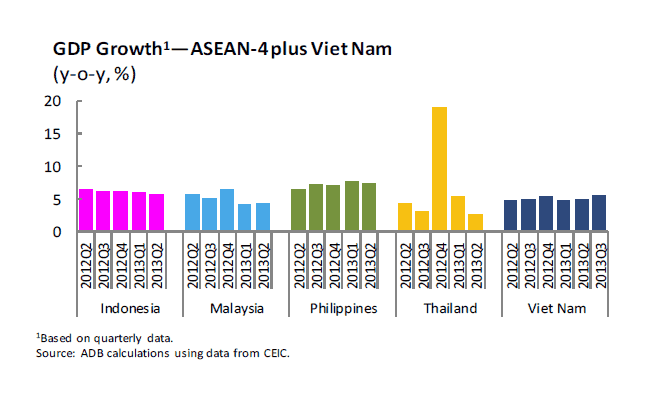
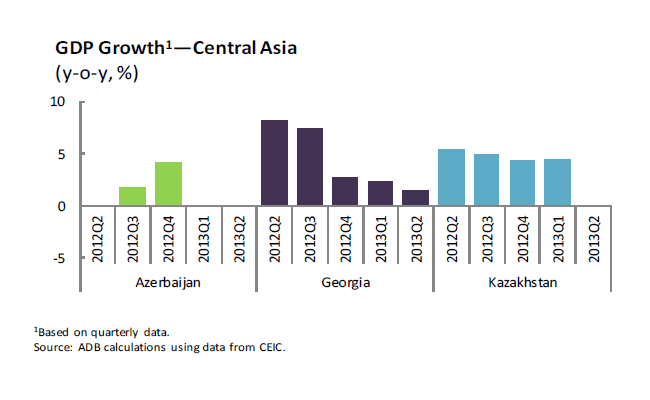
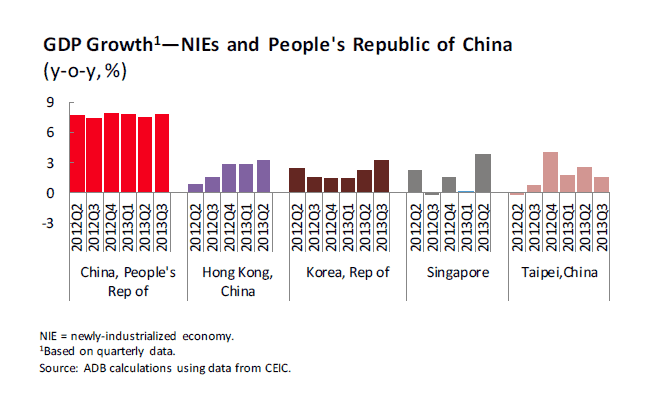
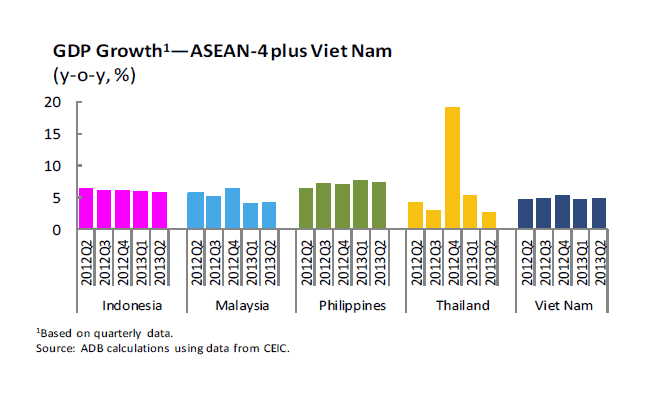
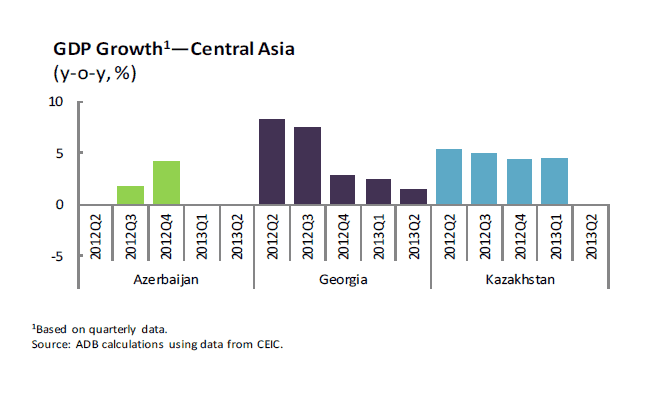
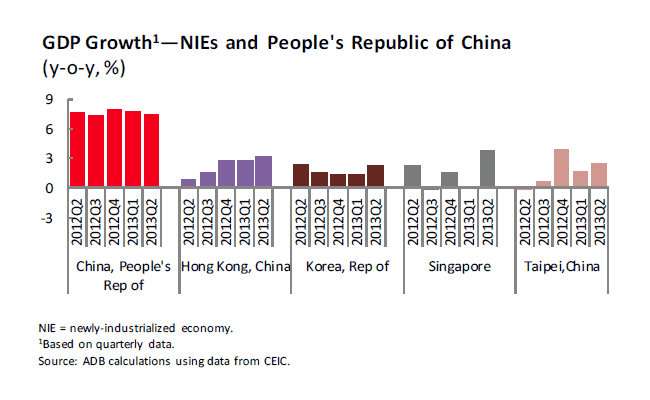
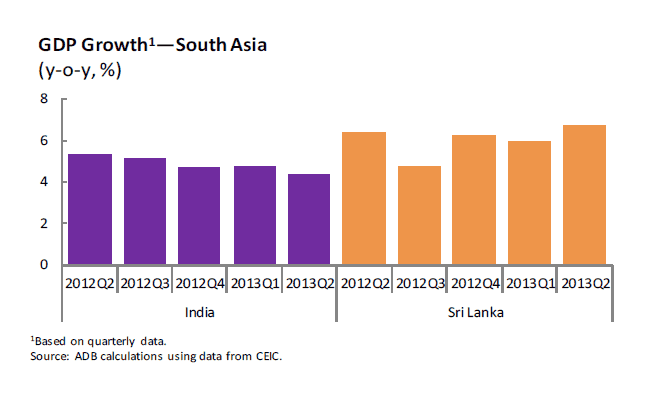
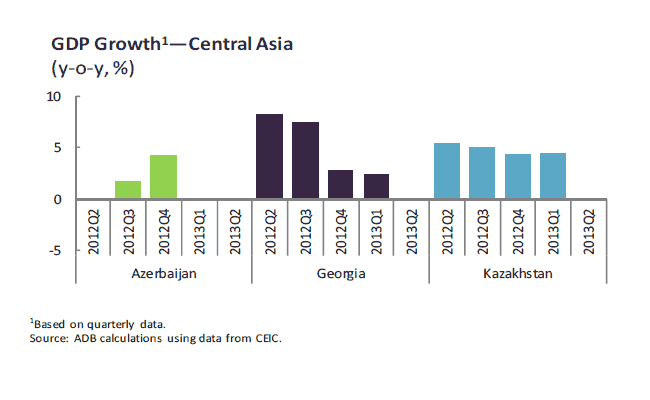
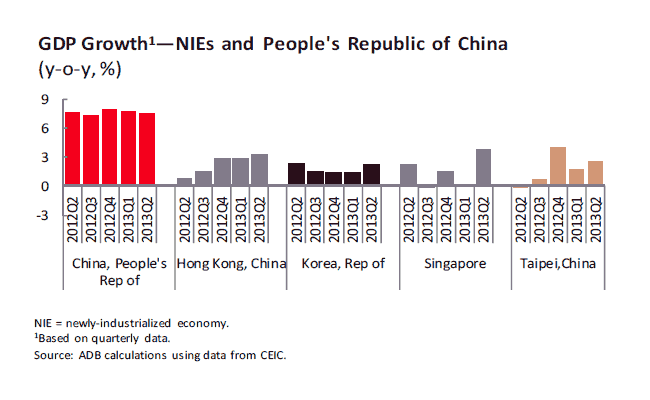
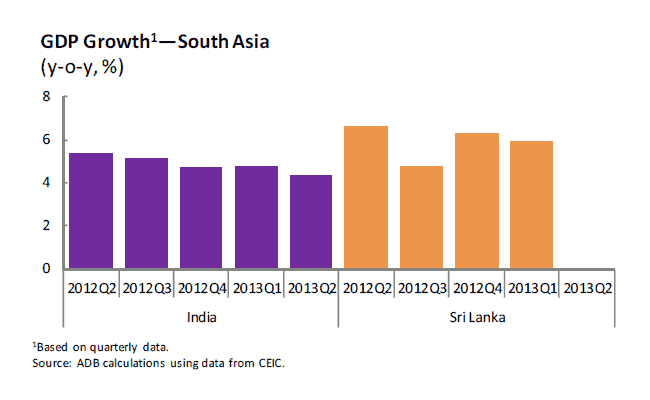
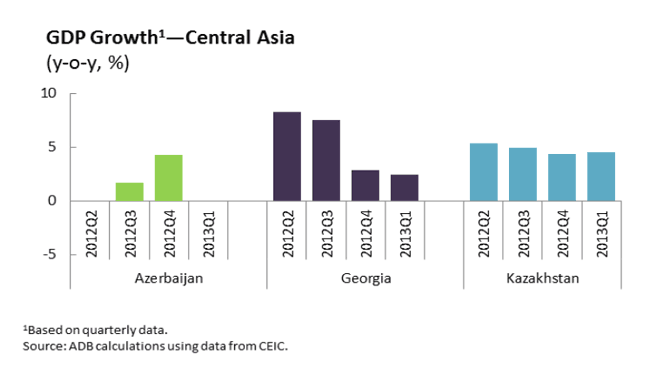
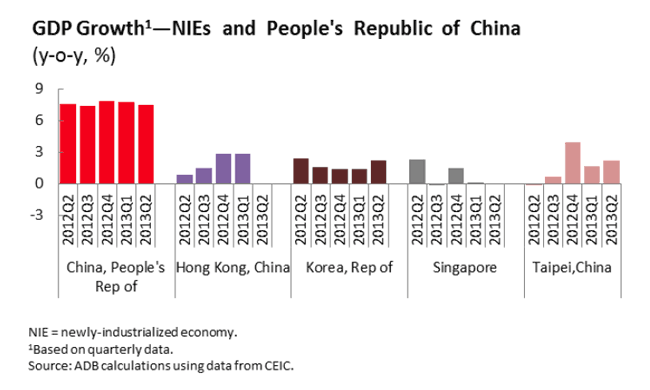
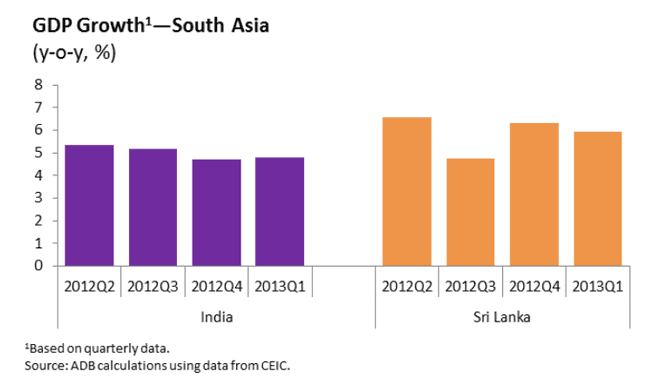
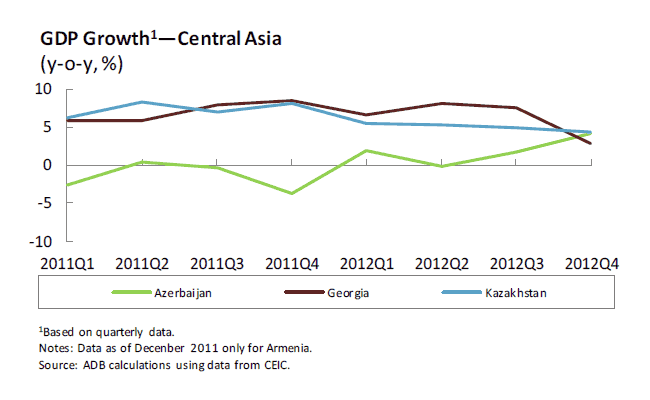
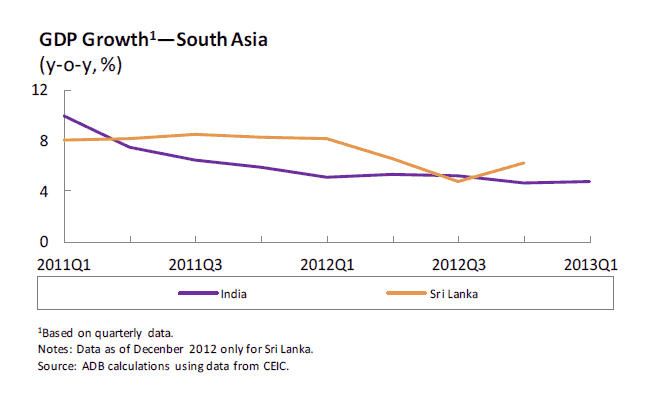
- GDP growth in Asia relatively flat.
SPECIAL FEATURE:
Early weakness in 2014?
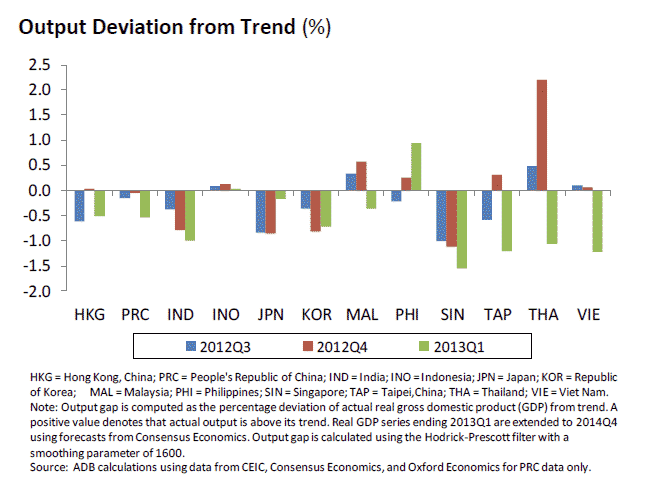
- Activity indicators in Asia are signaling some weakness ahead. Continued moderation in the PRC economy, and slowdown in economies that are open, globally connected, and beset by domestic challenges, may indicate some early weakness this year.
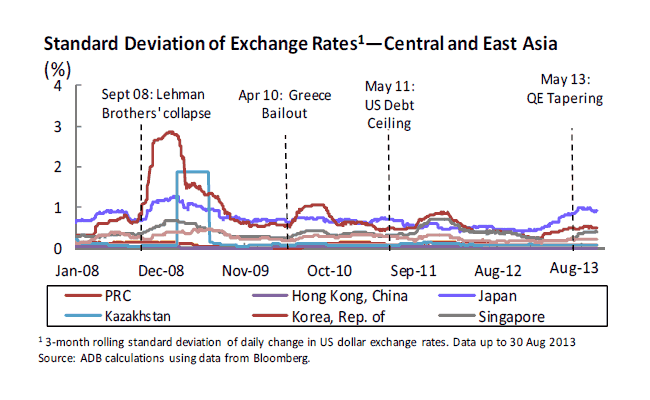
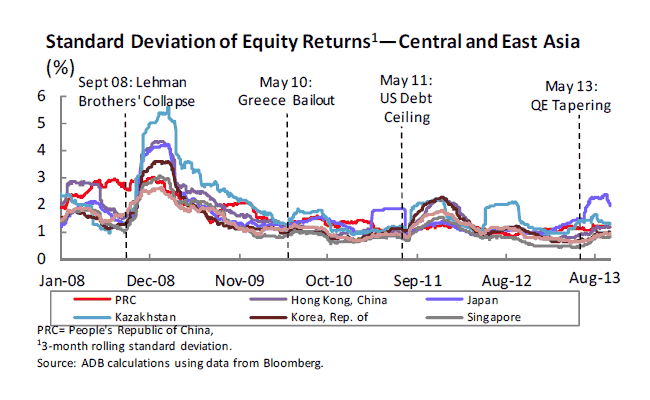
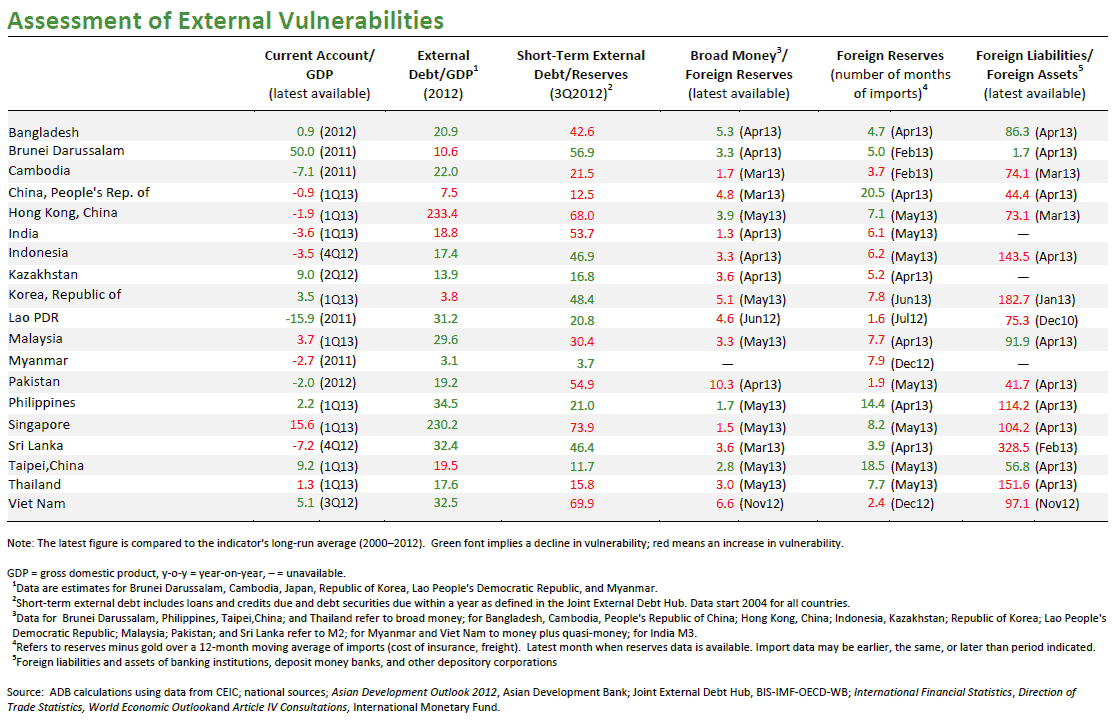
- The region’s financial markets were also dragged down by the combined weight of adverse domestic conditions and US Fed’s QE tapering. Favorable data releases could lift the market in the short term–although in the medium to long term, inflation and interest rate adjustments in the US and other advanced economies will determine the outcome.
FULL REPORT RCI NEWS AND EVENTS MONETARY, FINANCIAL AND TRADE INDICATORS
Global Markets
Financial Indicators
Equity Indexes
RemittancesChart | Data ASEAN-4 plus Viet Nam Chart | Data Kazakhstan Chart | Data NIEs and People’s Republic of China Chart | Data South Asia Chart | Data Inward Remittances—Southeast Asia Chart | Data Inward Remittances—South Asia Chart | Data Inward Remittances from the Middle East—Bangladesh, Pakistan, and the Philippines Chart | Data Inward Remittances—Georgia and Kyrgyz Republic Monetary Indicators
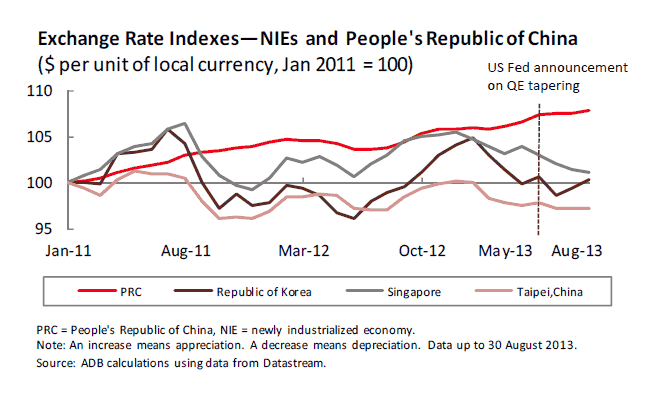
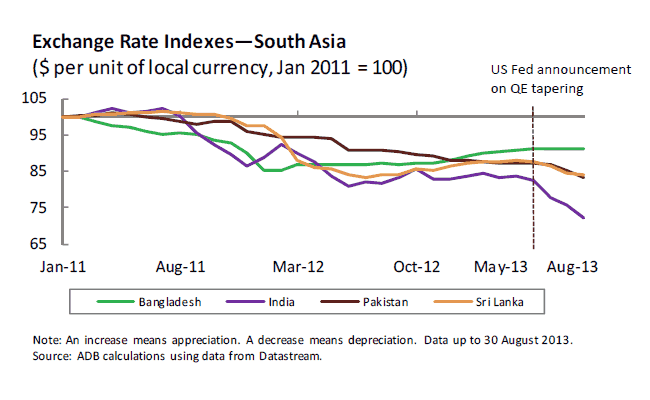
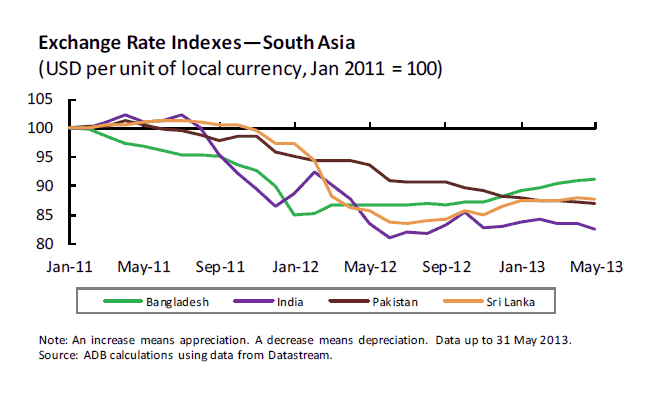
Exchange Rate Indexes
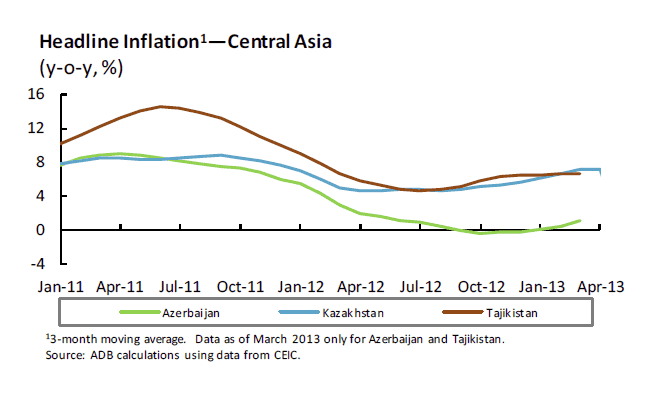
Headline InflationChart | Data ASEAN-4 plus Viet Nam Chart | Data Central Asia Chart | Data NIEs and People’s Republic of China Chart | Data South Asia
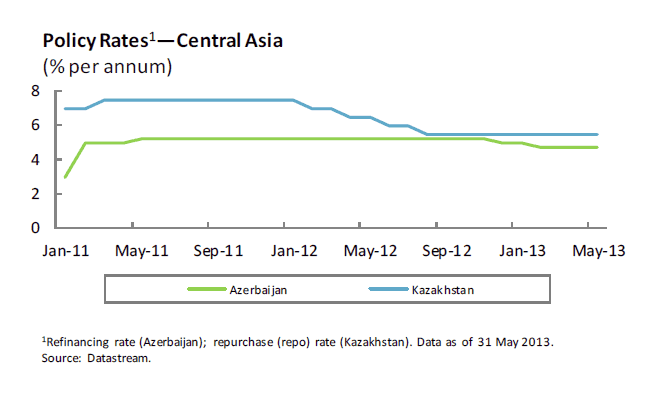
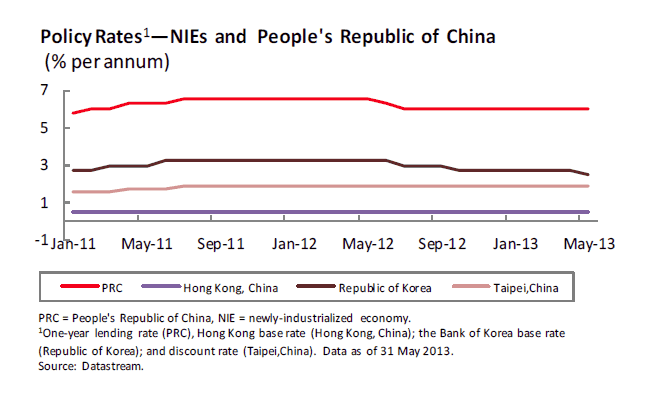
Policy RatesChart | Data ASEAN-4 plus Viet Nam Chart | Data Central Asia Chart | Data NIEs and People’s Republic of China Chart | Data South Asia
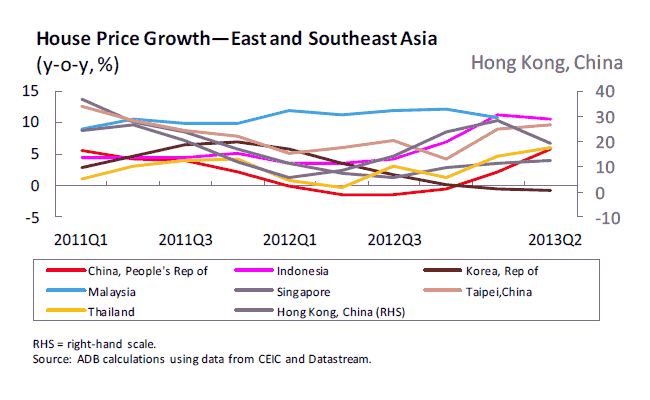
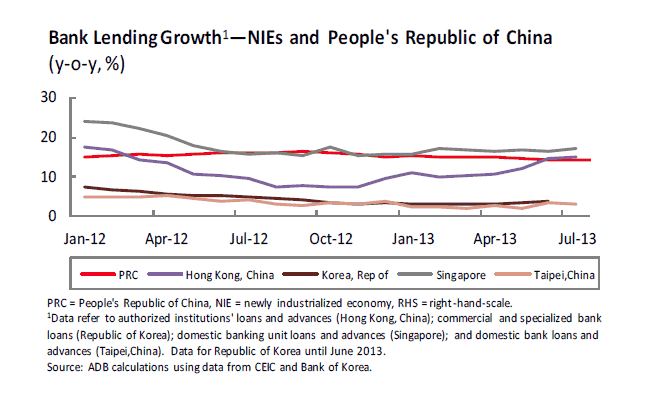
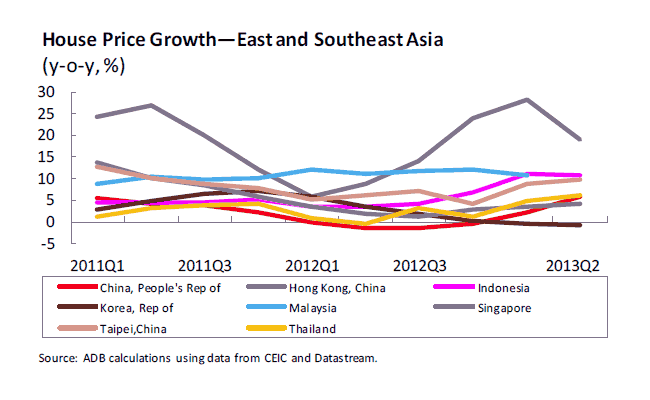
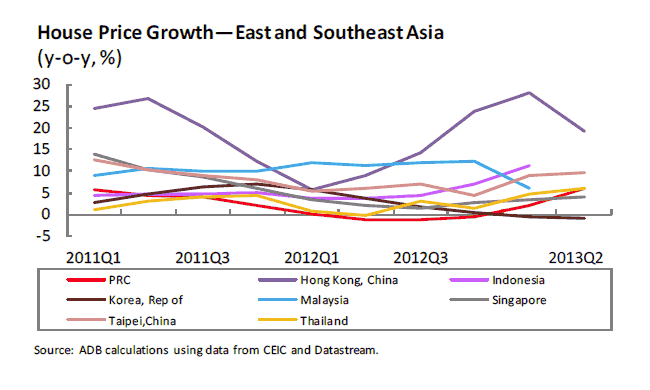
Bank LendingChart | Data ASEAN-4 plus Viet Nam Chart | Data Central Asia Chart | Data NIEs and People’s Republic of China Chart | Data South Asia Chart | Data ASEAN-4 plus Viet Nam Chart | Data South Asia and Kazakhstan Chart | Data NIEs and People’s Republic of China Chart | Data House Price Growth—East and Southeast Asia Output Indicators
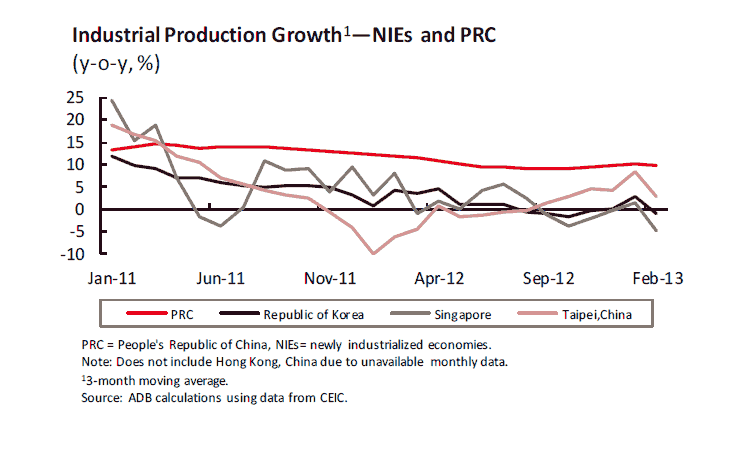
Industrial Production
Trade GrowthChart | Data ASEAN-4 plus Viet Nam Chart | Data Central Asia Chart | Data NIEs and People’s Republic of China Chart | Data South Asia
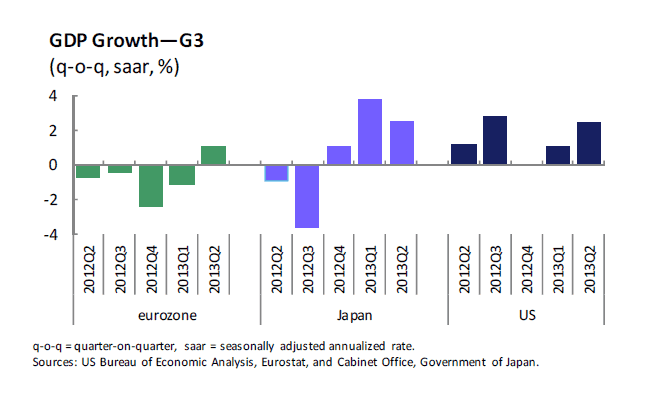
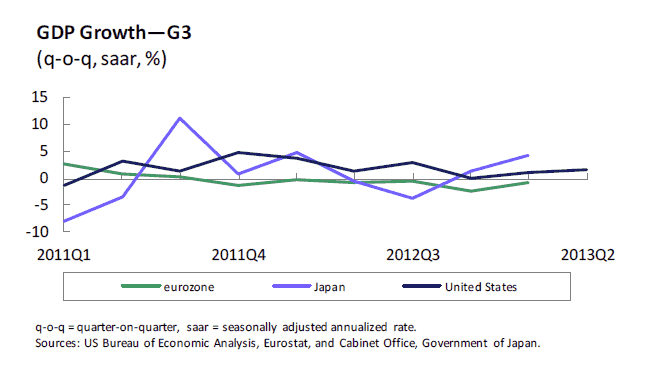
GDP Growth—G3Chart | Data Total Exports Chart | Data ASEAN-4 Chart | Data India Chart | Data People’s Republic of China
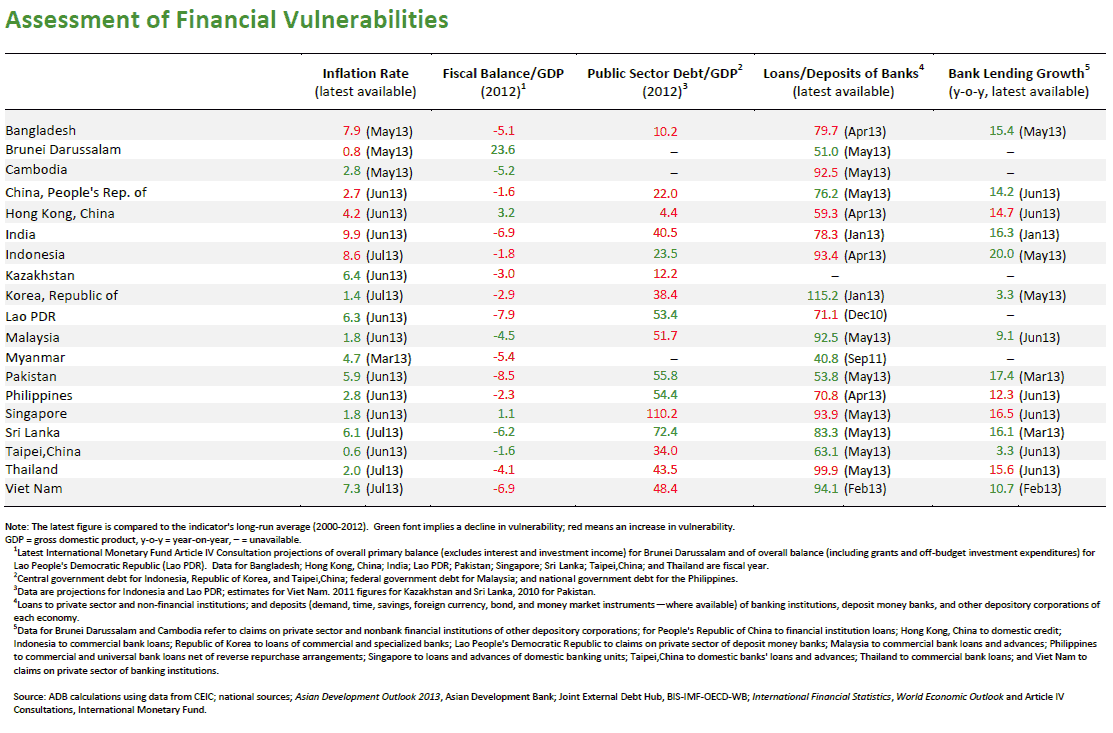
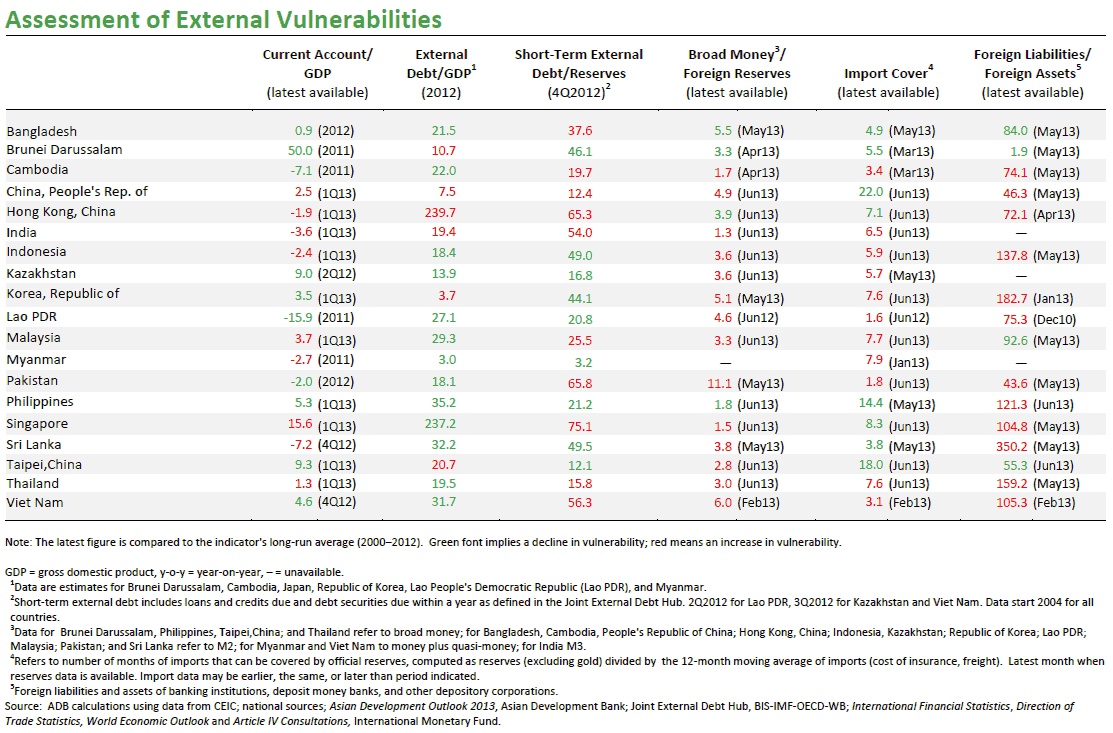
GDP Growth—AsiaChart | Data G3 Chart | Data US Chart | Data eurozone Chart | Data Japan Chart | Data ASEAN-4 plus Viet Nam Chart | Data Central Asia Chart | Data NIEs and People’s Republic of China Chart | Data South Asia Vulnerability Indicators
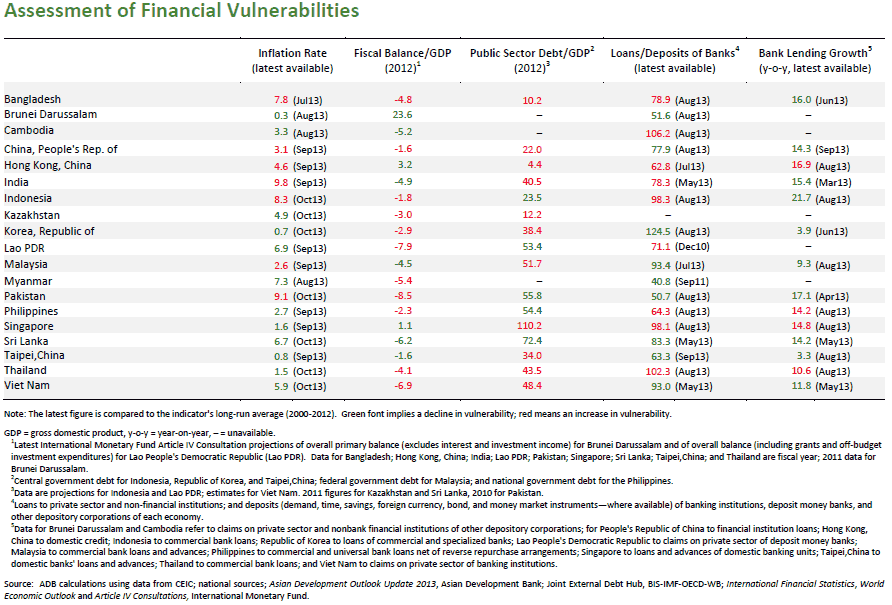
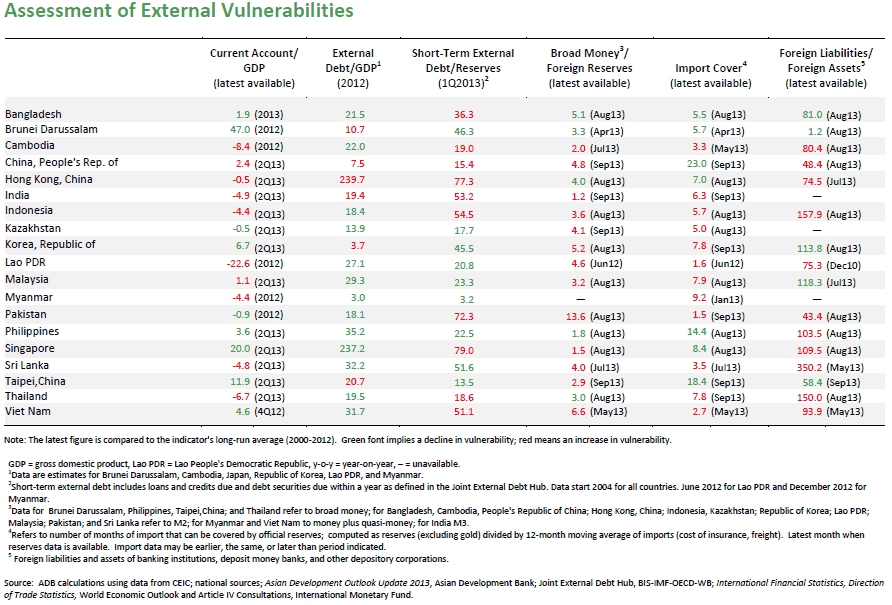
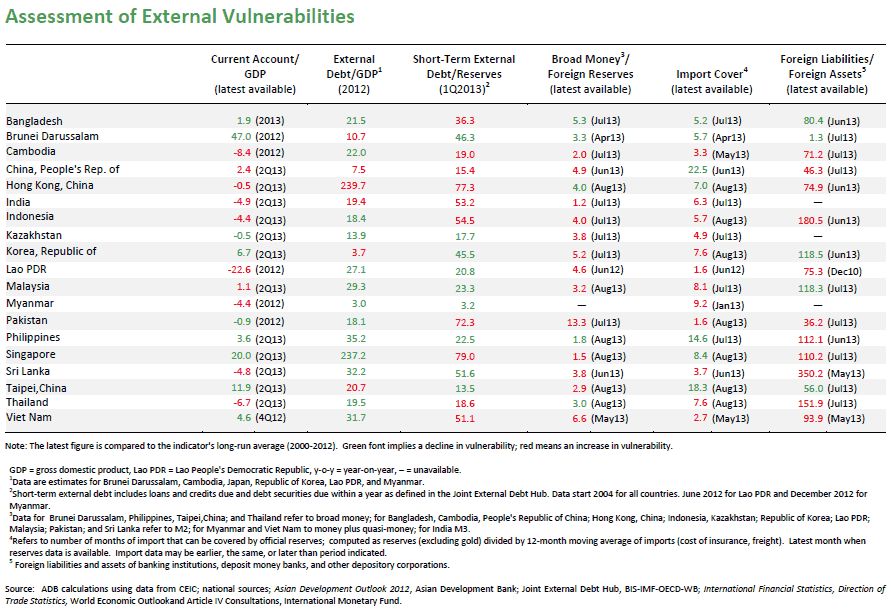
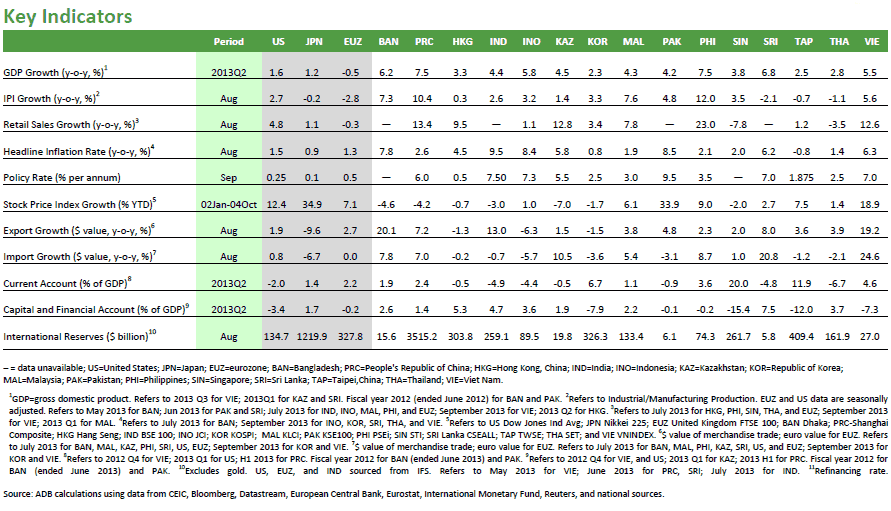
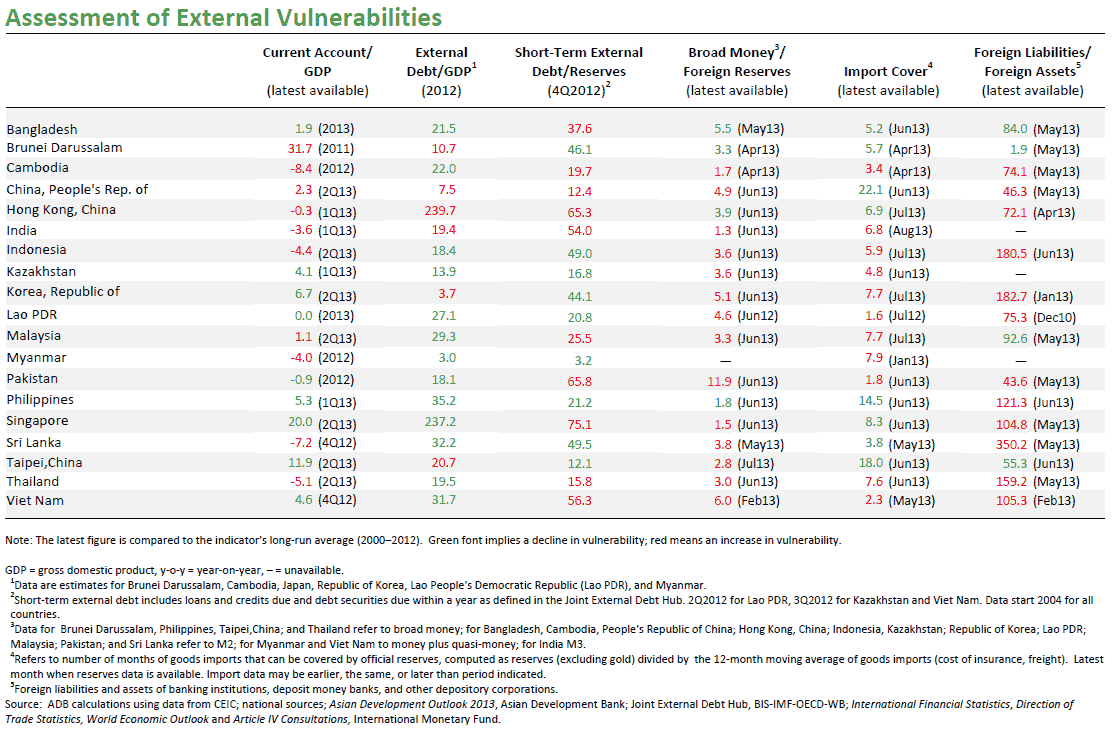
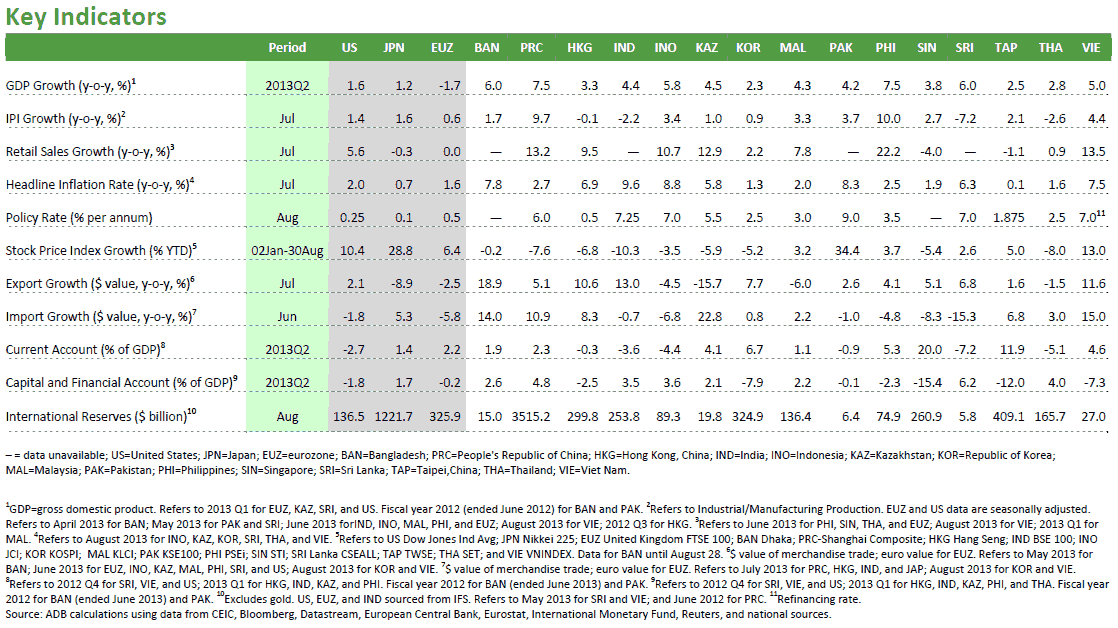
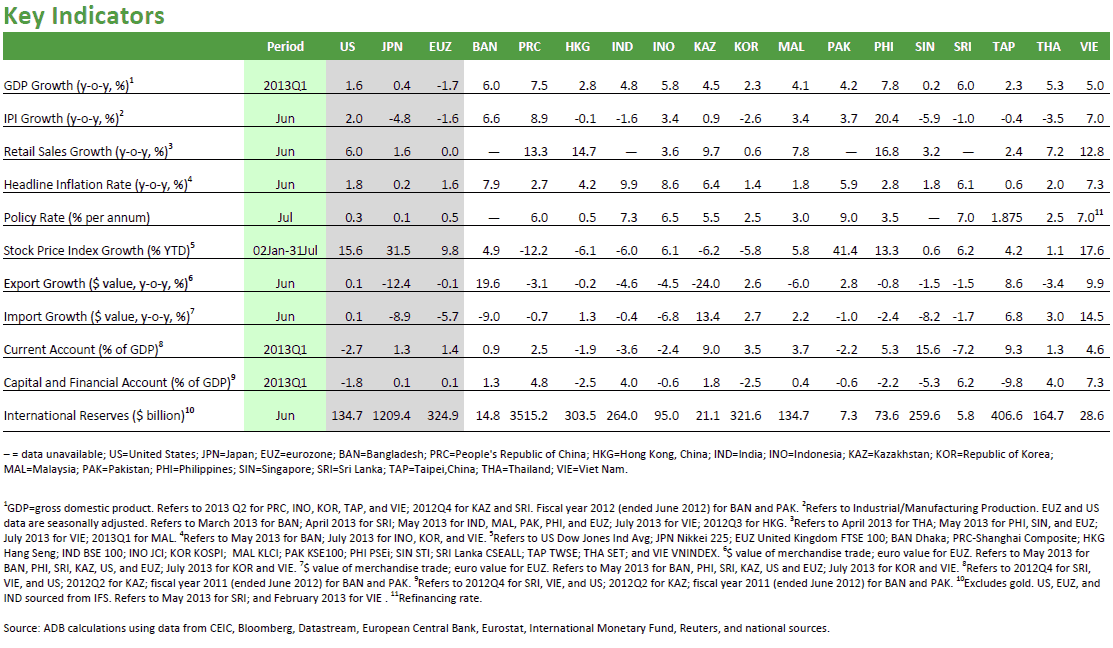
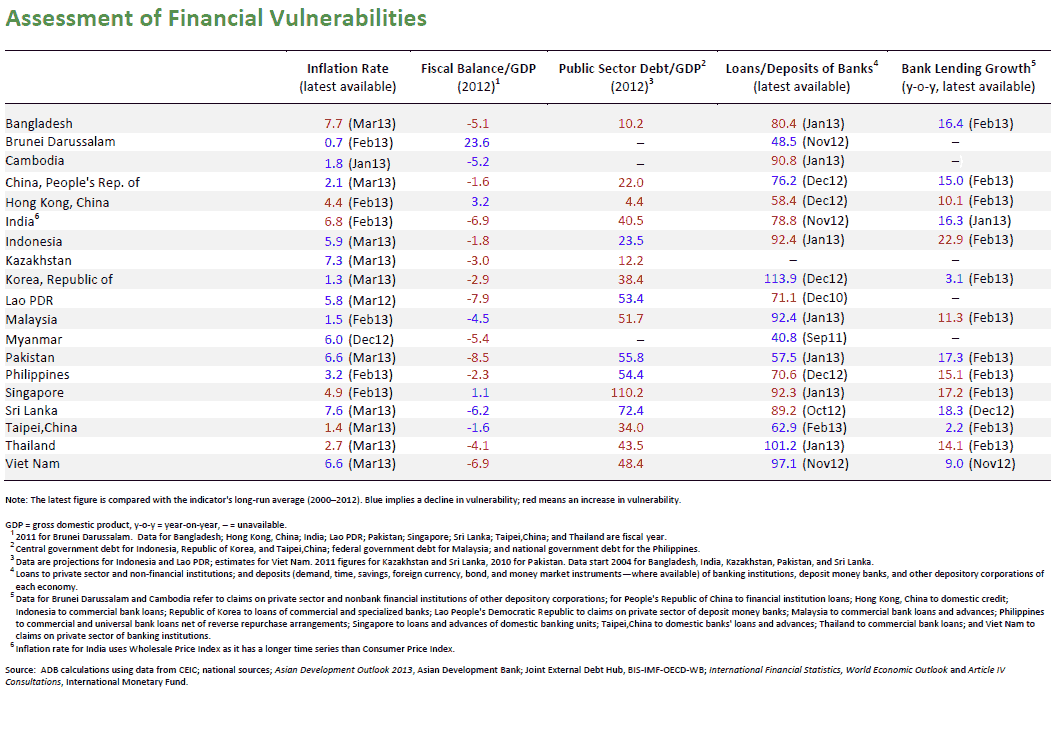
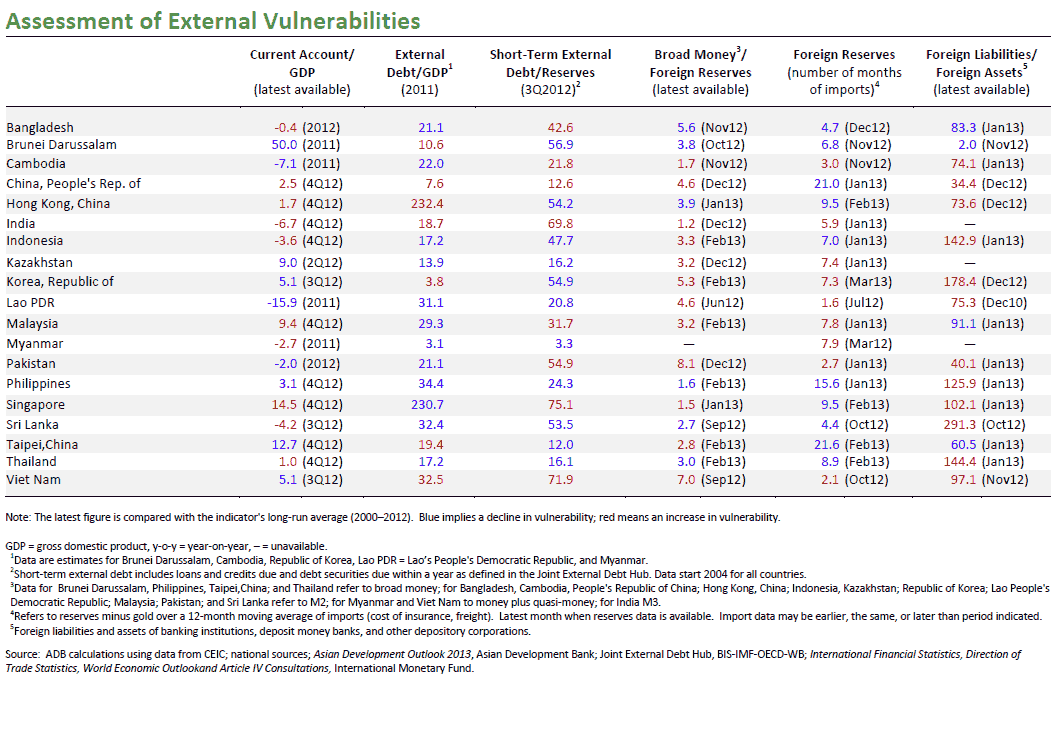
Key Indicators
 SPECIAL FEATURE:
Early weakness in 2014?
NOVEMBER 2013 • ISSUE NO. 7
FULL REPORT RCI NEWS AND EVENTS MONETARY, FINANCIAL AND TRADE INDICATORS
Global Markets
Financial Indicators
Equity Indexes
RemittancesChart | Data ASEAN-4 plus Viet Nam Chart | Data Kazakhstan Chart | Data NIEs and People’s Republic of China Chart | Data South Asia Chart | Data Inward Remittances—Southeast Asia Chart | Data Inward Remittances—South Asia Chart | Data Inward Remittances from the Middle East—Bangladesh, Pakistan, and the Philippines Chart | Data Inward Remittances—Georgia and Kyrgyz Republic Monetary Indicators
Exchange Rate Indexes
Headline InflationChart | Data ASEAN-4 plus Viet Nam Chart | Data Central Asia Chart | Data NIEs and People’s Republic of China Chart | Data South Asia
Policy RatesChart | Data ASEAN-4 plus Viet Nam Chart | Data Central Asia Chart | Data NIEs and People’s Republic of China Chart | Data South Asia
Bank LendingChart | Data ASEAN-4 plus Viet Nam Chart | Data Central Asia Chart | Data NIEs and People’s Republic of China Chart | Data South Asia Chart | Data ASEAN-4 plus Viet Nam Chart | Data South Asia and Kazakhstan Chart | Data NIEs and People’s Republic of China Chart | Data House Price—East and Southeast Asia Output Indicators
Industrial Production
Trade GrowthChart | Data ASEAN-4 plus Viet Nam Chart | Data Central Asia Chart | Data NIEs and People’s Republic of China Chart | Data South Asia
GDP Growth—G3Chart | Data Total Exports Chart | Data ASEAN-4 Chart | Data India Chart | Data People’s Republic of China
GDP Growth—AsiaChart | Data G3 Chart | Data US Chart | Data eurozone Chart | Data Japan Chart | Data ASEAN-4 plus Viet Nam Chart | Data Central Asia Chart | Data NIEs and People’s Republic of China Chart | Data South Asia Vulnerability Indicators
Key Indicators
 SPECIAL FEATURE:
Asia’s rising reliance on intraregional bank lending
OCTOBER 2013 • ISSUE NO. 6
FULL REPORT RCI NEWS AND EVENTS MONETARY, FINANCIAL AND TRADE INDICATORS
Global Markets
Financial Indicators
Equity Indexes
RemittancesChart | Data ASEAN-4 plus Viet Nam Chart | Data Kazakhstan Chart | Data NIEs and People’s Republic of China Chart | Data South Asia Chart | Data Inward Remittances—Southeast Asia Chart | Data Inward Remittances—South Asia Chart | Data Inward Remittances from the Middle East—Bangladesh, Pakistan, and the Philippines Chart | Data Inward Remittances —Georgia and Kyrgyz Republic Monetary Indicators
Exchange Rate Indexes
Headline InflationChart | Data ASEAN-4 plus Viet Nam Chart | Data Central Asia Chart | Data NIEs and People’s Republic of China Chart | Data South Asia
Policy RatesChart | Data ASEAN-4 plus Viet Nam Chart | Data Central Asia Chart | Data NIEs and People’s Republic of China Chart | Data South Asia
Bank LendingChart | Data ASEAN-4 plus Viet Nam Chart | Data Central Asia Chart | Data NIEs and People’s Republic of China Chart | Data South Asia Chart | Data ASEAN-4 plus Viet Nam Chart | Data South Asia and Kazakhstan Chart | Data NIEs and People’s Republic of China Chart | Data House Price—East and Southeast Asia Output Indicators
Industrial Production
Trade GrowthChart | Data ASEAN-4 plus Viet Nam Chart | Data Central Asia Chart | Data NIEs and People’s Republic of China Chart | Data South Asia
GDP Growth—G3Chart | Data Total Exports Chart | Data ASEAN-4 Chart | Data India Chart | Data People’s Republic of China
GDP Growth—AsiaChart | Data G3 Chart | Data US Chart | Data eurozone Chart | Data Japan Chart | Data ASEAN-4 plus Viet Nam Chart | Data Central Asia Chart | Data NIEs and People’s Republic of China Chart | Data South Asia Vulnerability Indicators
Key Indicators
 SPECIAL FEATURE: Can US recovery help Asian exports?
SEPTEMBER 2013 • ISSUE NO. 5
FULL REPORT RCI NEWS AND EVENTS MONETARY, FINANCIAL AND TRADE INDICATORS
Global Markets
Financial Indicators
Equity Indexes
RemittancesChart | Data ASEAN-4 plus Viet Nam Chart | Data Kazakhstan Chart | Data NIEs and People’s Republic of China Chart | Data South Asia Chart | Data Inward Remittances—Southeast Asia Chart | Data Inward Remittances—South Asia Chart | Data Inward Remittances from the Middle East—Bangladesh, Pakistan, and the Philippines Chart | Data Outward Remittances—Kazakhstan Monetary Indicators
Exchange Rate Indexes
Headline InflationChart | Data ASEAN-4 plus Viet Nam Chart | Data Central Asia Chart | Data NIEs and People’s Republic of China Chart | Data South Asia
Policy RatesChart | Data ASEAN-4 plus Viet Nam Chart | Data Central Asia Chart | Data NIEs and People’s Republic of China Chart | Data South Asia
Bank LendingChart | Data ASEAN-4 plus Viet Nam Chart | Data Central Asia Chart | Data NIEs and People’s Republic of China Chart | Data South Asia Chart | Data ASEAN-4 plus Viet Nam Chart | Data South Asia and Kazakhstan Chart | Data NIEs and People’s Republic of China Chart | Data House Price—East and Southeast Asia Output Indicators
Industrial Production
Trade GrowthChart | Data ASEAN-4 plus Viet Nam Chart | Data Central Asia Chart | Data NIEs and People’s Republic of China Chart | Data South Asia
GDP Growth—G3Chart | Data Total Exports Chart | Data ASEAN-4 Chart | Data India Chart | Data People’s Republic of China
GDP Growth—AsiaChart | Data G3 Chart | Data US Chart | Data eurozone Chart | Data Japan Chart | Data ASEAN-4 plus Viet Nam Chart | Data Central Asia Chart | Data NIEs and People’s Republic of China Chart | Data South Asia Vulnerability Indicators
Key Indicators
 SPECIAL FEATURE: Asian Currency and Equity Market Volatility
AUGUST 2013 • ISSUE NO. 4
FULL REPORT RCI NEWS AND EVENTS MONETARY, FINANCIAL AND TRADE INDICATORS
Global Markets
Financial Indicators
Equity Indexes
RemittancesChart | Data ASEAN-4 plus Viet Nam Chart | Data Kazakhstan Chart | Data NIEs and People’s Republic of China Chart | Data South Asia Chart | Data Inward Remittances—Southeast Asia Chart | Data Inward Remittances—South Asia Chart | Data Inward Remittances from the Middle East—Bangladesh, Pakistan, and the Philippines Chart | Data Outward Remittances—Kazakhstan Monetary Indicators
Exchange Rate Indexes
Headline InflationChart | Data ASEAN-4 plus Viet Nam Chart | Data Central Asia Chart | Data NIEs and People’s Republic of China Chart | Data South Asia
Policy RatesChart | Data ASEAN-4 plus Viet Nam Chart | Data Central Asia Chart | Data NIEs and People’s Republic of China Chart | Data South Asia
Bank LendingChart | Data ASEAN-4 plus Viet Nam Chart | Data Central Asia Chart | Data NIEs and People’s Republic of China Chart | Data South Asia Chart | Data ASEAN-4 plus Viet Nam Chart | Data South Asia and Kazakhstan Chart | Data NIEs and People’s Republic of China Chart | Data House Price Growth—East and Southeast Asia Output Indicators
Industrial Production
Trade GrowthChart | Data ASEAN-4 plus Viet Nam Chart | Data Central Asia Chart | Data NIEs and People’s Republic of China Chart | Data South Asia
GDP Growth—G3Chart | Data Total Exports Chart | Data ASEAN-4 Chart | Data India Chart | Data People’s Republic of China
GDP Growth—AsiaChart | Data G3 Chart | Data US Chart | Data eurozone Chart | Data Japan Chart | Data ASEAN-4 plus Viet Nam Chart | Data Central Asia Chart | Data NIEs and People’s Republic of China Chart | Data South Asia Vulnerability Indicators
Key Indicators
 SPECIAL FEATURE: Risk of Credit Boom in Asia
JULY 2013 • ISSUE NO. 3
FULL REPORT RCI NEWS AND EVENTS MONETARY, FINANCIAL AND TRADE INDICATORS
Global Markets
Financial Indicators
Equity Indexes
RemittancesChart | Data Equity Indexes—ASEAN-4 plus Viet Nam Chart | Data Equity Index—Kazakhstan Chart | Data Equity Indexes—NIEs and People’s Republic of China Chart | Data Equity Indexes—South Asia Chart | Data Inward Remittances—Southeast Asia Chart | Data Inward Remittances—South Asia Chart | Data Inward Remittances from Middle East—Bangladesh, Pakistan, and the Philippines Chart | Data Outward Remittances—Kazakhstan Monetary Indicators
Exchange Rate Indexes
Headline InflationChart | Data Exchange Rate Indexes—ASEAN-4 plus Viet Nam Chart | Data Exchange Rate Indexes—Central Asia Chart | Data Exchange Rate Indexes—NIEs and People’s Republic of China Chart | Data Exchange Rate Indexes—South Asia
Policy RatesChart | Data Headline Inflation—ASEAN-4 plus Viet Nam Chart | Data Headline Inflation—Central Asia Chart | Data Headline Inflation—NIEs and People’s Republic of China Chart | Data Headline Inflation—South Asia
Bank LendingChart | Data Policy Rates—ASEAN-4 plus Viet Nam Chart | Data Policy Rates—Central Asia Chart | Data Policy Rates—NIEs and People’s Republic of China Chart | Data Policy Rates—South Asia Chart | Data Bank Lending Growth—ASEAN-4 plus Viet Nam Chart | Data Bank Lending Growth—Kazakhstan Chart | Data Bank Lending Growth—NIEs and People’s Republic of China Chart | Data Bank Lending Growth—South Asia Output Indicators
Trade Linkages
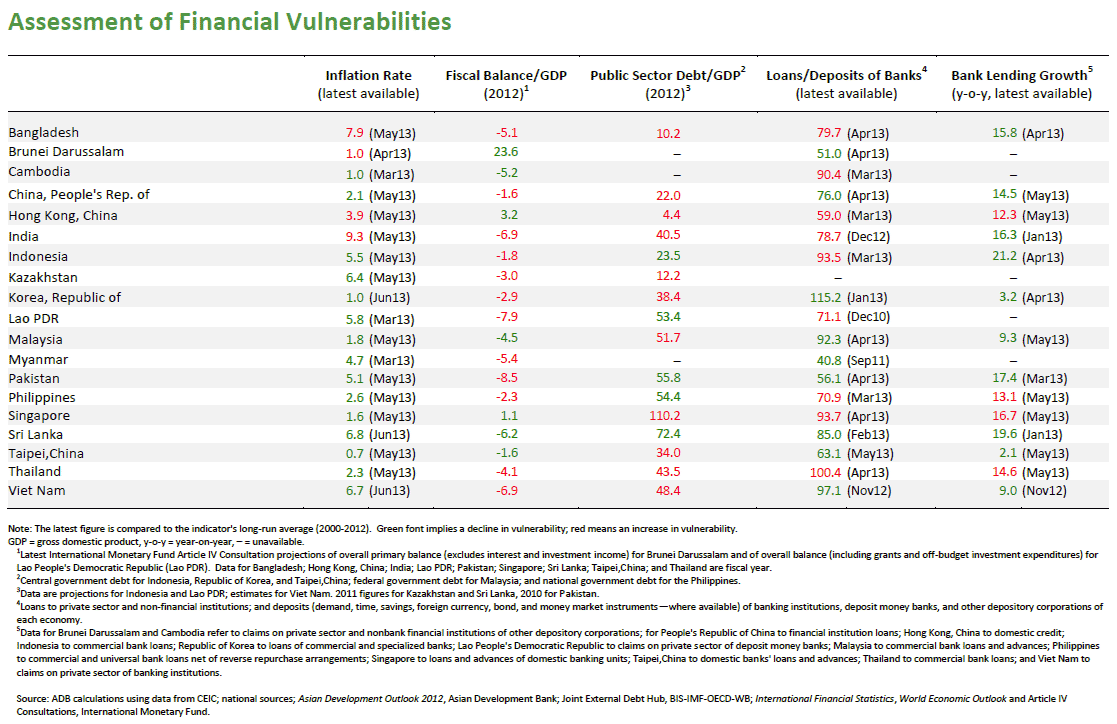
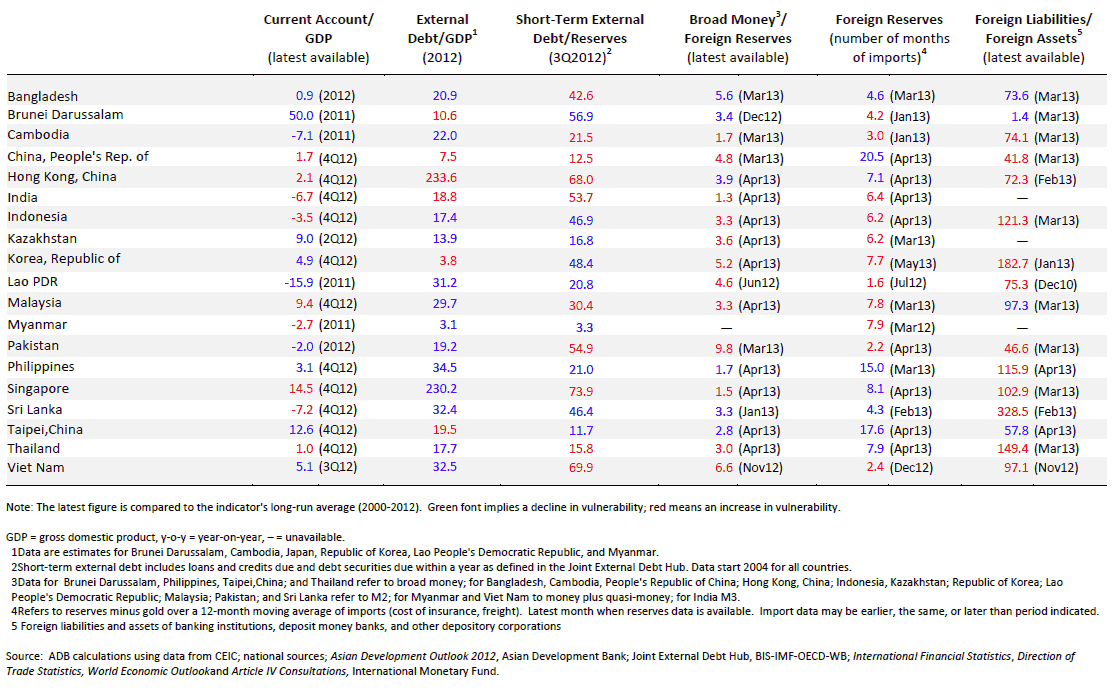
Vulnerability Indicators
Key Indicators
 SPECIAL FEATURE: Assessing the monetary policy stance in Asia
JUNE 2013 • ISSUE NO. 2
FULL REPORT RCI NEWS AND EVENTS MONETARY, FINANCIAL AND TRADE INDICATORS
Global Markets
Financial Indicators
Equity Indexes
RemittancesChart | Data Equity Indexes—ASEAN-4 plus Viet Nam Chart | Data Equity Index—Kazakhstan Chart | Data Equity Indexes—NIEs and PRC Chart | Data Equity Indexes—South Asia Chart | Data Inward Remittances—Southeast Asia Chart | Data Inward Remittances—South Asia Chart | Data Inward Remittances from Middle East—Bangladesh, Pakistan, and the Philippines Chart | Data Outward Remittances—Kazakhstan Monetary Indicators
Exchange Rate Indexes
Headline InflationChart | Data Exchange Rate Indexes—ASEAN-4 plus Viet Nam Chart | Data Exchange Rate Index—Kazakhstan Chart | Data Exchange Rate Indexes—NIEs and PRC Chart | Data Exchange Rate Indexes—South Asia
Policy RatesChart | Data Headline Inflation—ASEAN-4 plus Viet Nam Chart | Data Headline Inflation—Central Asia Chart | Data Headline Inflation—NIEs and PRC Chart | Data Headline Inflation—South Asia
Bank LendingChart | Data Policy Rates—ASEAN-4 plus Viet Nam Chart | Data Policy Rates—Central Asia Chart | Data Policy Rates—NIEs and PRC Chart | Data Policy Rates—South Asia Chart | Data Bank Lending Growth—ASEAN-4 plus Viet Nam Chart | Data Bank Lending Growth—Kazakhstan Chart | Data Bank Lending Growth—NIEs and PRC Chart | Data Bank Lending Growth—South Asia Output Indicators
Industrial Production
GDP Growth G3Chart | Data Industrial Production Growth—ASEAN-4 plus Viet Nam Chart | Data Industrial Production Growth—Central Asia Chart | Data Industrial Production Growth—NIEs and PRC Chart | Data Industrial Production Growth—South Asia
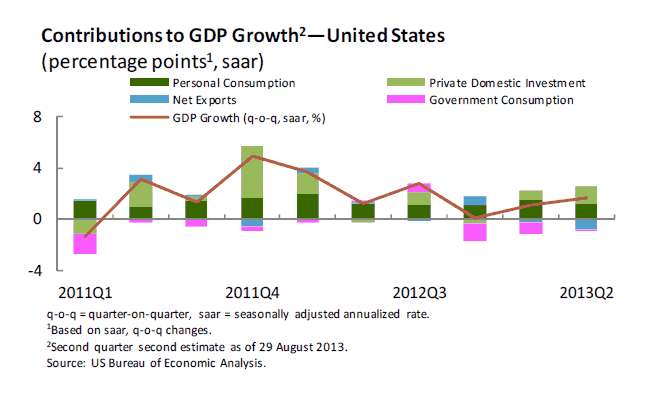
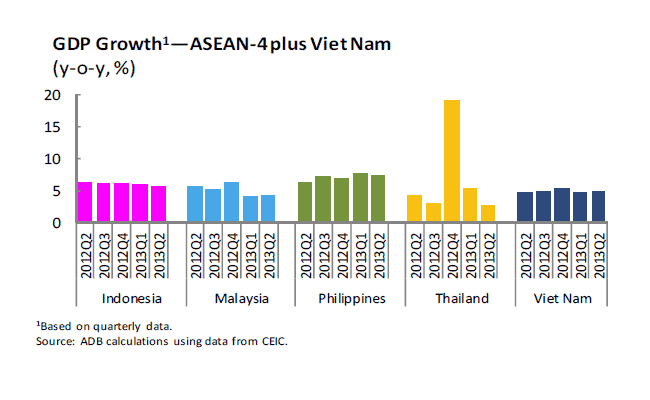
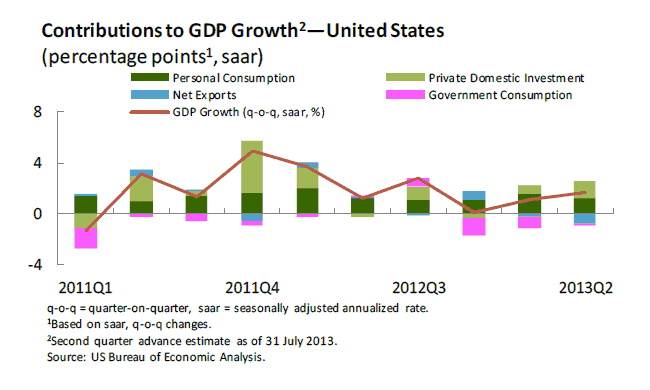
GDP Growth AsiaChart | Data GDP Growth—G3 Chart | Data Contributions to GDP Growth2—United States Chart | Data Contributions to GDP Growth2—eurozone Chart | Data Contributions to GDP Growth—Japan Chart | Data GDP Growth1—ASEAN-4 plus Viet Nam Chart | Data GDP Growth1—Central Asia Chart | Data GDP Growth1—NIEs and People’s Republic of China Chart | Data GDP Growth1—South Asia Trade Linkages
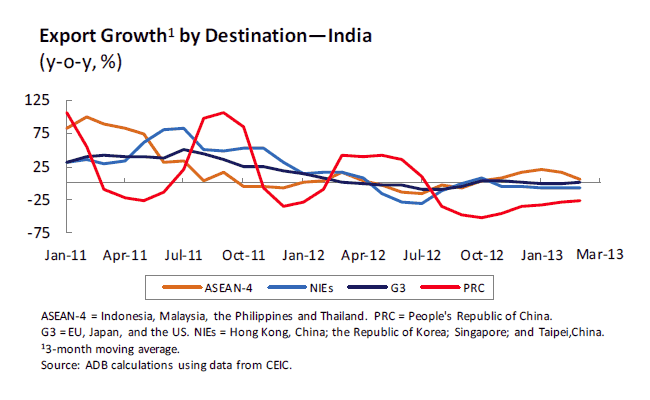
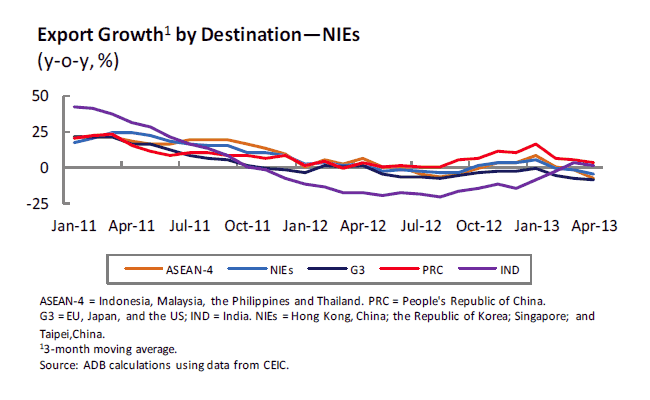
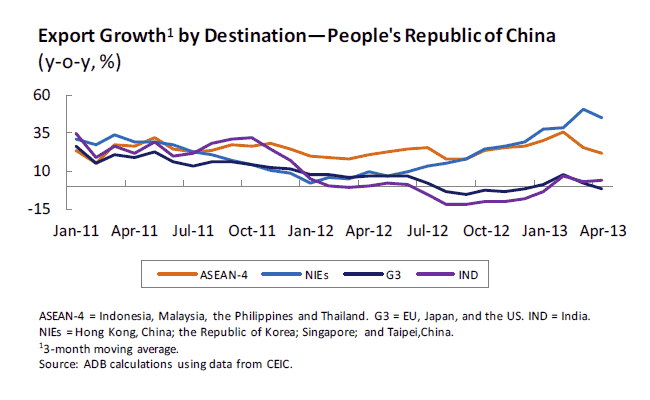
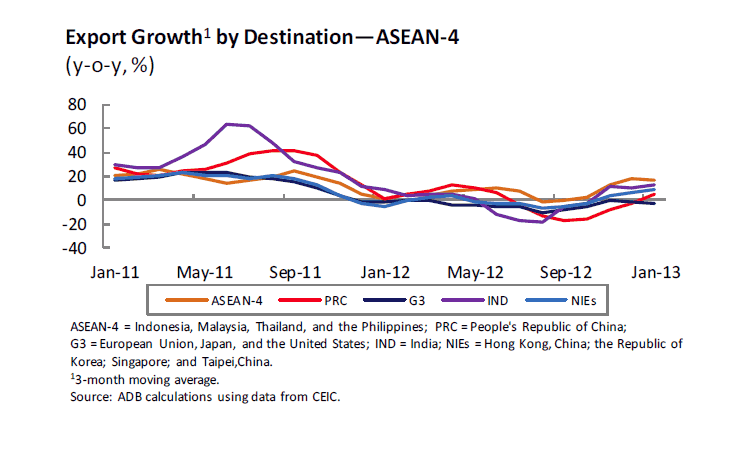
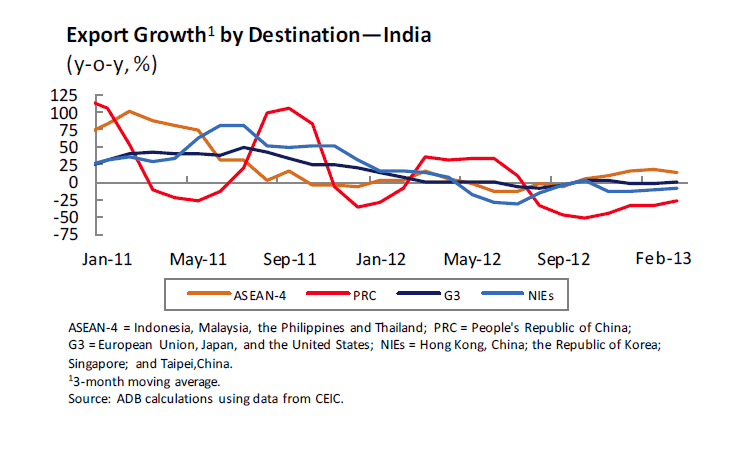
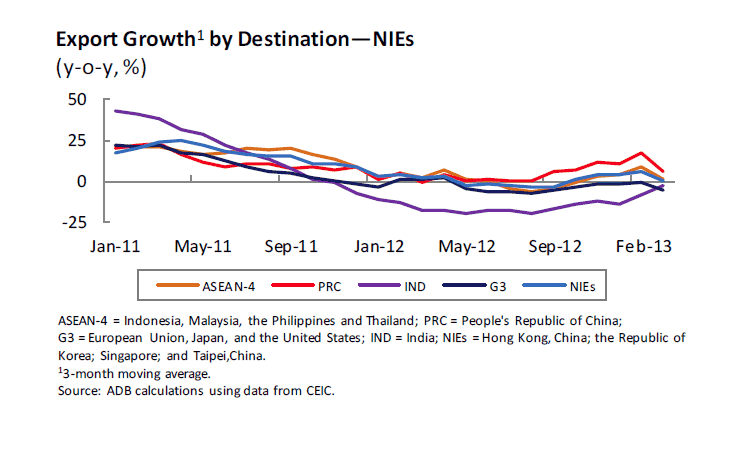
Export Growth by Destination
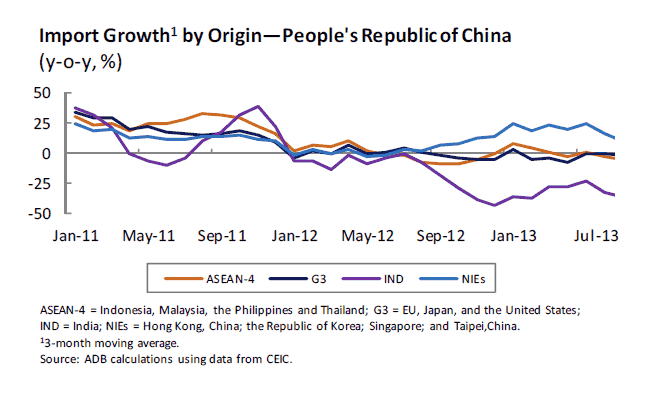
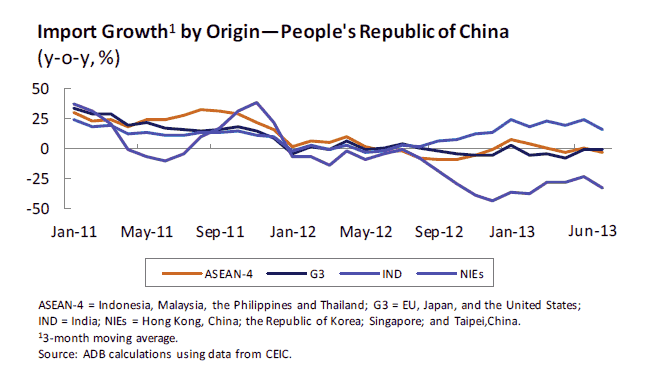
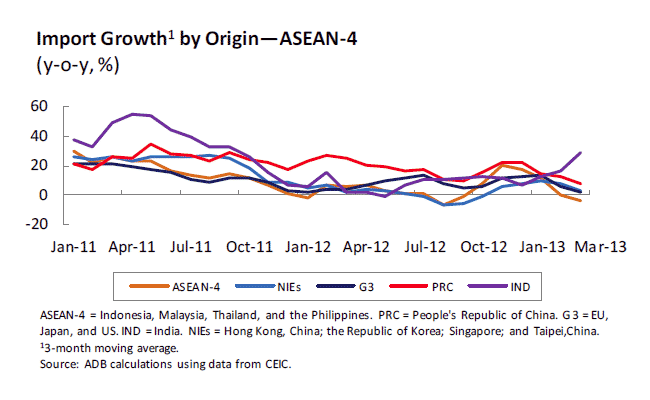
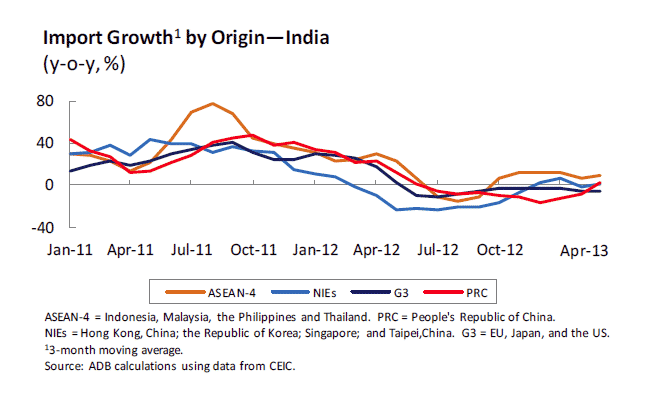
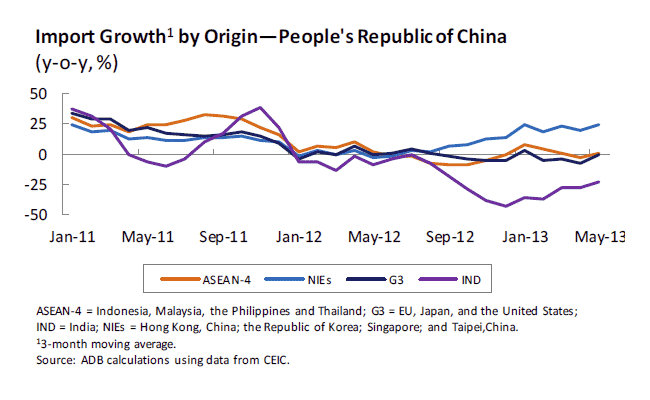
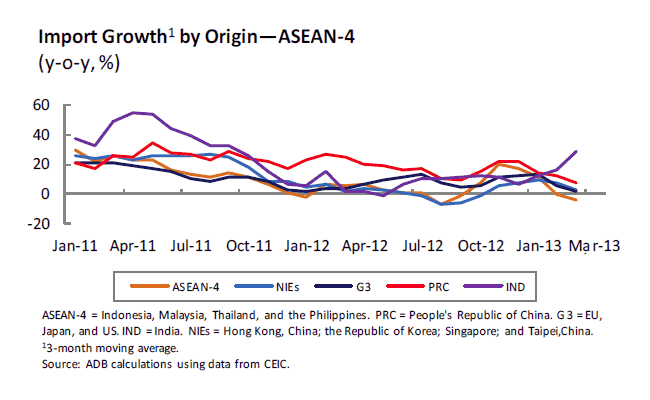
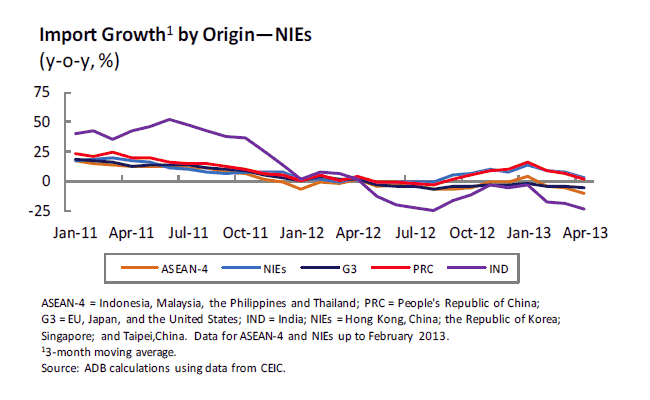
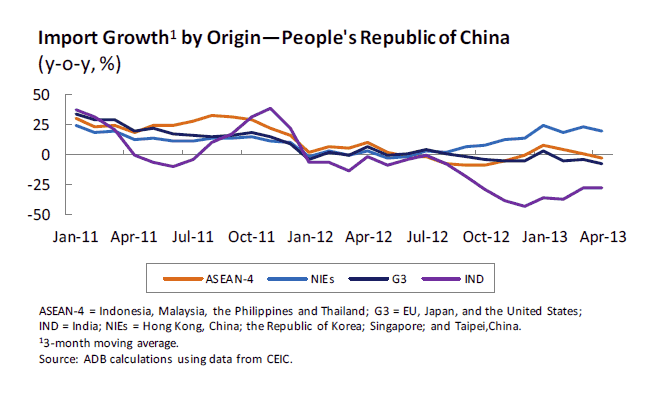
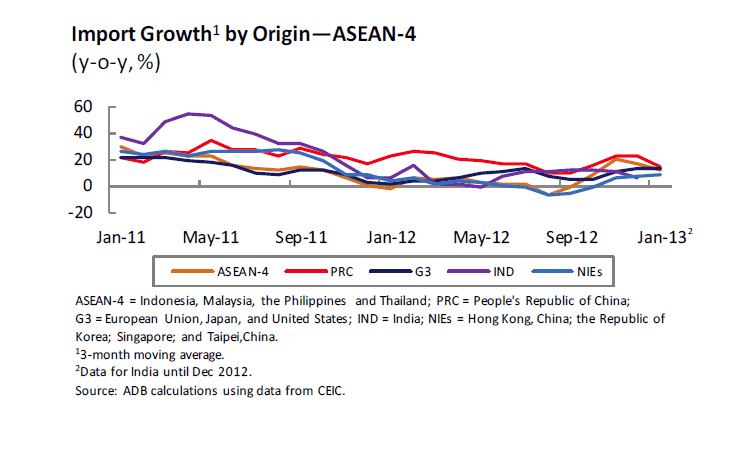
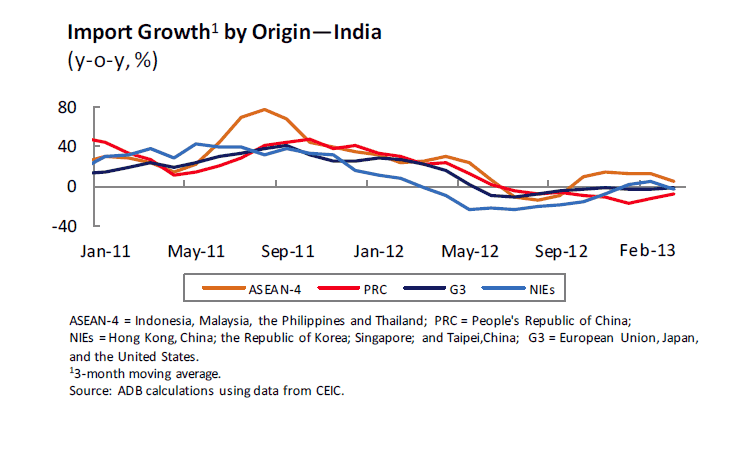
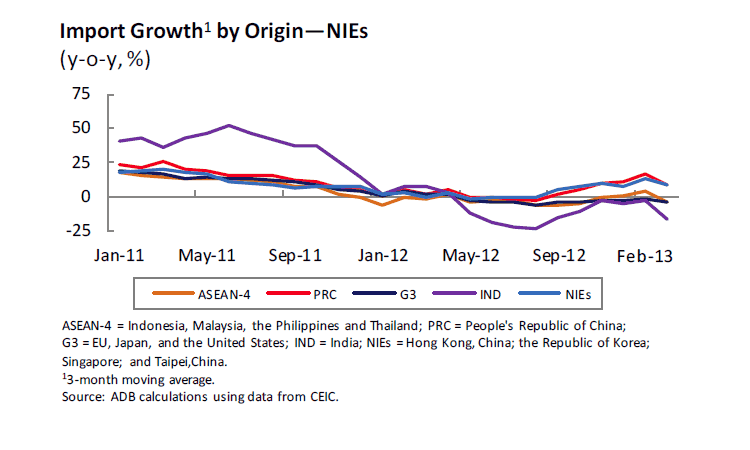
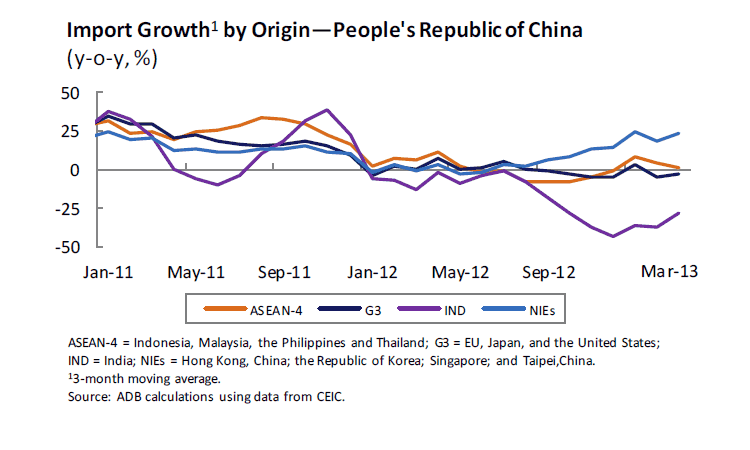
Import Growth by OriginChart | Data Export Growth by Destination—ASEAN-4 Chart | Data Export Growth by Destination—India Chart | Data Export Growth by Destination—NIEs Chart | Data Export Growth by Destination—People’s Republic of China Chart | Data Import Growth by Origin—ASEAN-4 Chart | Data Import Growth by Origin—India Chart | Data Import Growth by Origin—NIEs Chart | Data Import Growth by Origin—People’s Republic of China Vulnerability Indicators
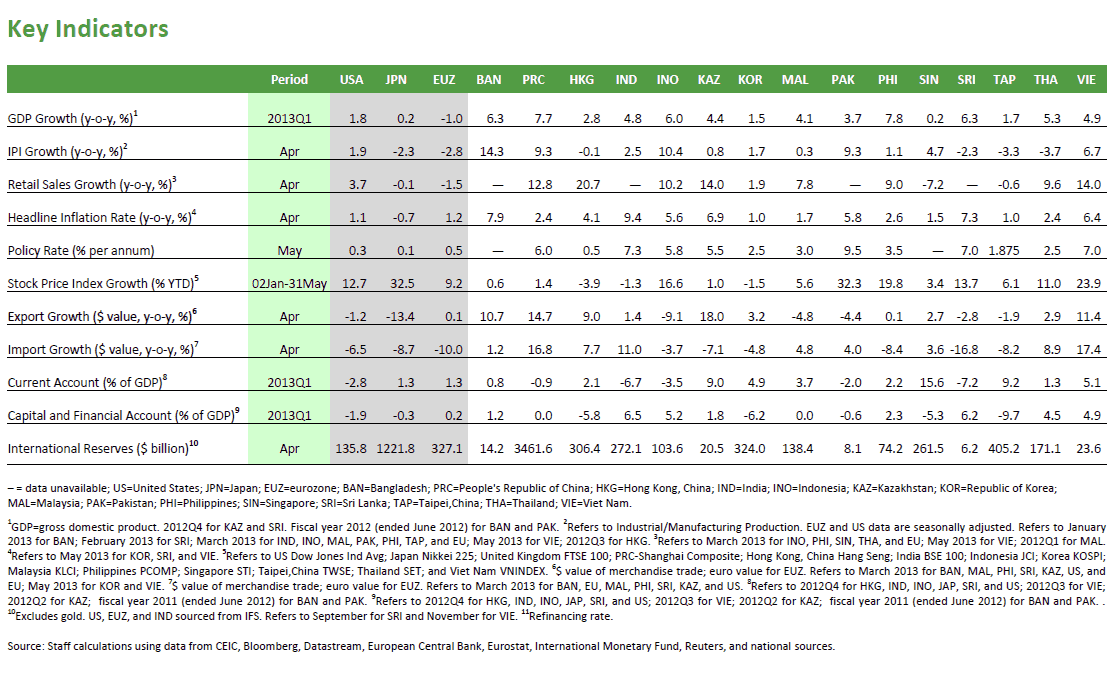
Key Indicators
MAY 2013 • ISSUE NO. 1
FULL REPORT RCI NEWS AND EVENTS MONETARY, FINANCIAL AND TRADE INDICATORS
Global Markets
Financial Indicators
Equity Indexes
RemittancesChart | Data Equity Indexes—ASEAN-4 plus Viet Nam Chart | Data Equity Index—Kazakhstan Chart | Data Equity Indexes—NIEs and PRC Chart | Data Equity Indexes—South Asia Chart | Data Inward Remittances—Southeast Asia Chart | Data Inward Remittances—South Asia Chart | Data Inward Remittances from Middle East—Bangladesh, Pakistan, and the Philippines Chart | Data Outward Remittances—Kazakhstan Monetary Indicators
Exchange Rate Indexes
InflationChart | Data Exchange Rate Indexes—ASEAN-4 plus Viet Nam Chart | Data Exchange Rate Index—Kazakhstan Chart | Data Exchange Rate Indexes—NIEs and PRC Chart | Data Exchange Rate Indexes—South Asia
Policy RatesChart | Data Headline Inflation—ASEAN-4 plus Viet Nam Chart | Data Headline Inflation—Central Asia Chart | Data Headline Inflation—NIEs and PRC Chart | Data Headline Inflation—South Asia
Bank LendingChart | Data Policy Rates—ASEAN-4 plus Viet Nam Chart | Data Policy Rates—Central Asia Chart | Data Policy Rates—NIEs and PRC Chart | Data Policy Rates—South Asia Chart | Data Bank Lending Growth—ASEAN-4 plus Viet Nam Chart | Data Bank Lending Growth—Kazakhstan Chart | Data Bank Lending Growth—NIEs and PRC Chart | Data Bank Lending Growth—South Asia Output Indicators
Trade Linkages
Export Growth by Destination
Import Growth by OriginChart | Data Export Growth by Destination—ASEAN-4 Chart | Data Export Growth by Destination—India Chart | Data Export Growth by Destination—NIEs Chart | Data Export Growth by Destination—People’s Republic of China Chart | Data Import Growth by Origin—ASEAN-4 Chart | Data Import Growth by Origin—India Chart | Data Import Growth by Origin—NIEs Chart | Data Import Growth by Origin—People’s Republic of China Vulnerability Indicators
Key Indicators
Office of Regional Economic Integration
Asia Regional Integration Center
The monthly Regional Cooperation and Integration (RCI) Information Pack monitors RCI news and events, categorized under the four RCI pillars of (i) cross-border infrastructure, (ii) trade and investment, (iii) money and finance, and (iv) regional public goods. It also presents high-frequency monetary, financial, and trade indicators, which�taken together�can help monitor the economic links between the economies of Asia and the Pacific, and major partners outside the region. The RCI Information Pack is published by the Asian Development Bank (ADB), produced by ADB�s Office of Regional Economic Integration (OREI).
How to reach us
Asian Development Bank
Office of Regional Economic Integration
6 ADB Avenue Mandaluyong City 1550 Metro Manila, Philippines
Telephone: +63 2 632 6302
Facsimile: +63 2 636 2183
E-mail: aric_info@adb.org
Office of Regional Economic Integration
6 ADB Avenue Mandaluyong City 1550 Metro Manila, Philippines
Telephone: +63 2 632 6302
Facsimile: +63 2 636 2183
E-mail: aric_info@adb.org